SQL挖掘银行潜在贷款客户
一、案例背景介绍——Thera Bank潜在贷款客户增量需求
Thera Bank储蓄客户较多,但贷款客户较少,为了扩大经营利润,该行推出了一个活动,通过该活动,贷款率达到9.6%,由于该案例未能透漏初始预期目标,所以不能准确评价活动效果,该文重点研究贷款客户特征,以此为基础,勾勒潜在贷款客户特征,挖掘潜在客户,提升贷款转化率。
二、数据集说明
该数据集来源是在kaggle上获取的银行贷款模型:
。数据集包括5000个观察值,14个变量,其又可划分为4个类别的变量:二元字段、区间字段、序数字段、名义字段相关数据说明如下表:


根据上述字段变量,可以刻画潜在人物画像,大致分为三个维度:特征分析、负债分析、业务分析等。
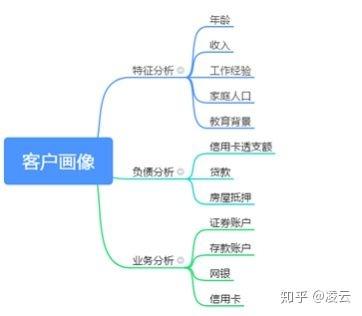
通过上述三个维度指标可以得出:客户是否我行粘性客户,社会地位如何以及目前负债的状况,通过这些立体的刻画,可以得出什么样的客户才是潜在客户,从而制定合理有效的精准营销方案。
三、提出问题
- 验证上年推广活动的贷款人数占比
- 贷款人群年龄分布
- 贷款人群家庭人口分布
- 贷款人群中学历分布
- 贷款人群收入分布
- 贷款人群中信用卡透支额分布
- 贷款人群中网银设施分布
- 贷款人群中存款账户分布
四、数据处理。
1、导入数据源文件
将下载的数据源保存为CSV格式导入nvicat中,在导入的同时,修改成正确的字符类型,(这里可以直接通过设计表修改或者在导入的其中一步可以修改,麻烦点的可以用代码修改)
2、表重命名
为简便代码输入,将表名修改为loan,代码操作如下:
rename table bank_Personal_Loan_Modelling to loan;3、缺失值处理
使用如下代码可以实现检测缺失值
select family from loan where family is null;由于该案例数据集比较完整,所以就不再考虑缺失值问题
五、构建模型
1、验证推广活动贷款率
select personal_loan as '是否贷款',count(personal_loan) as '人数' ,
concat(round(count(personal_loan)*100 /(select count(*) from loan ),1),'%') as '人数占比' from loan,
group by personal_loan
通过以上代码可以得出如下结果:

由结果可知,5000名客户中共有480名客户贷款,贷款率为9.6%,根据这个数值,可以考核活动推广效果以及深层次分析贷款客户特征,进而适时调整营销方案,从而挖掘出更多潜在客户。
2、年龄特征分析
首先分析贷款客户群体中最小最大年龄,然后将年龄按5岁组距划分,即[26-31)、[31-36)、[36-41)、[41-46)、[46-51)、[51-56)、[56-61)、[61-65]。实现代码及结果分别如下:
select max(age), min(age) from loan ,where personal_loan=1;
select (case when age>=26 and age <31 then '26-31'
when age>=31 and age <36 then '31-36'
when age>=36 and age <41 then '36-41'
when age>=41 and age <46 then '41-46'
when age>=46 and age <51 then '46-51'
when age>=51 and age <56 then '51-56'
when age>=56 and age <61 then '56-61'
when age>=61 and age <=65 then '61-65' else age  end) as '年龄分组',
sum(case when personal_loan=1 then 1 else 0 end) as '贷款人数',count(age)as '人数',
concat(round(sum(case when personal_loan=1 then 1 else 0 end)*100/count(age),2),'%')as '贷款率' from loan
group by (case when age>=26 and age <31 then '26-31'
when age>=31 and age <36 then '31-36'
when age>=36 and age <41 then '36-41'
when age>=41 and age <46 then '41-46'
when age>=46 and age <51 then '46-51'
when age>=51 and age <56 then '51-56'
when age>=56 and age <61 then '56-61'
when age>=61 and age <=65 then '61-65'  else age  end)
order by age
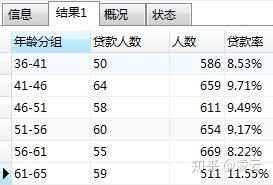
将上述用图表显示如下:

说明在上述代码运行中,结果会显示多余的年龄,因它们所在区间没有贷款,所有不作考虑,经图示显示,26-36,61-65区间的贷款率较高。(因该案例在国外,所以国情不同,在国内会考虑合适的贷款区间的)
3、家庭人口特征分析
主要分析家庭人口数对贷款的影响,下面用sql处理可得:
select family as '家庭人口数',
sum(case when personal_loan=1 then 1 else 0 end) as '贷款人数',
count(family) as '总人数',
concat(round(sum(case when personal_loan=1 then 1 else 0 end)*100/count(family),2),'%')as '贷款率' from loan
where family in ('1','2','3','4')
group by family
order by family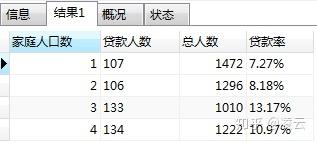
上述结果可知,家庭人口数越多,贷款率越高。
下面在综合分析家庭人口数和年龄层次对贷款率的影响如下图所示:

通过图示反映,年龄区间在31-36的,无论家庭人口数是多少,相对贷款人数都较多,说明在该年龄段中,家庭人数不是影响贷款的必要因素,到了这个年龄段,贷款意愿较强。从纵向各个年龄段叠加分析可知,人口多的贷款人数占比高,说明孩子在贷款中起了推动作用,后续营销推广时,不仅可以在相关政策中打折优惠,也可以从孩子角度开发新的营销点。
4、学历分析
select education as '学历分布',
sum(case when personal_loan=1 then 1 else 0 end)as '贷款人数',
count(education) as '人数' ,
concat(round(sum(case when personal_loan=1 then 1 else 0 end)*100/count(education),2),'%')as '贷款率' from loan
where education in ('1','2','3')
group by education
order by education
结果如下:
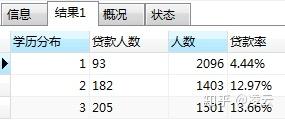
结果表明:学历越高,贷款率越高,这与实际情况相符,银行青睐高学历贷款人群。
5、收入分析
首先求出贷款收入分布区间
select max(income)as '最高收入',min(income) as '最低收入' from loan
where personal_loan=1
结果展示如下:

下面将收入以20为组距分组,求出各自下的贷款率
select (case when income>=60 and income <80 then '60-80'
when income>=80 and income <100 then '80-100'
when income>=100 and income <120 then '100-120'
when income>=120 and income <140 then '120-140'
when income>=140 and income <160 then '140-160'
when income>=160 and income <180 then '160-180'
when income>=180 and income <200 then '180-200'
when income>=200 and income <220 then '200-220'else income  end) as '收入分组',
sum(case when personal_loan=1 then 1 else 0 end) as '贷款人数',count(income)as '人数',
concat(round(sum(case when personal_loan=1 then 1 else 0 end)*100/count(income),2),'%')as '贷款率' from loan
group by(case when income>=60 and income <80 then '60-80'
when income>=80 and income <100 then '80-100'
when income>=100 and income <120 then '100-120'
when income>=120 and income <140 then '120-140'
when income>=140 and income <160 then '140-160'
when income>=160 and income <180 then '160-180'
when income>=180 and income <200 then '180-200'
when income>=200 and income <220 then '200-220'else income  end)
order by income
该代码求出的结果中包含非贷款结果,该文主要考虑的是贷款与收入的关系,因此,只取其中贷款部分结果
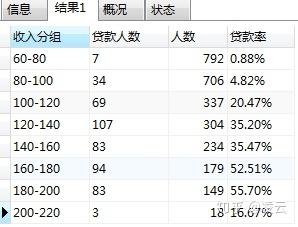
通过结果显示:收入在100千美元以后的贷款率相对较高,其中收入在160-200之间的贷款率甚至过半,这种情况非常乐观,但处于两端的相对较低,一个因收入较低容易被拒贷或者消费观念比较保守,另外一个高收入者因不差钱贷款意愿较低。
6、信用卡透支额分析
方法和上文类似,首先求出贷款下信用卡最高、最低透支额
select max(ccavg)as '最高透支额',min(ccavg)as '最低透支额' from loan
where personal_loan=1
接下来将以2为组距,求出各组距下的贷款率
select (case when ccavg >=0 and ccavg  <2 then '0-2'
when ccavg >=2 and ccavg  <4 then '2-4'
when ccavg >=4 and ccavg  <6 then '4-6'
when ccavg >=6 and ccavg  <8 then '6-8'
when ccavg >=8 and ccavg  <=10 then '8-10'else ccavg  end) as '信用卡透支额分组',
sum(case when personal_loan=1 then 1 else 0 end) as '贷款人数',count(ccavg)as '人数',
concat(round(sum(case when personal_loan=1 then 1 else 0 end)*100/count(ccavg),2),'%')as '贷款率' from loan
group by(case when ccavg >=0 and ccavg  <2 then '0-2'
when ccavg >=2 and ccavg  <4 then '2-4'
when ccavg >=4 and ccavg  <6 then '4-6'
when ccavg >=6 and ccavg  <8 then '6-8'
when ccavg >=8 and ccavg  <=10 then '8-10'else ccavg  end)
order by ccavg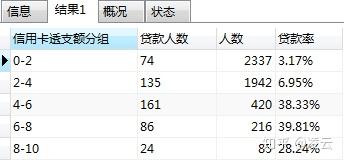
结果表明:信用卡透支额在4-8区间的贷款率较高,其次是8-10区间的,而信用卡透支额在0-4区间的人群基数较大,但贷款率却不理想。
7、网银设施分析
下面分析网银设施在贷款中所起的作用:
select online as '网银设施', sum(case when personal_loan=1 then 1 else 0 end) as '贷款人数',
concat(round(sum(case when personal_loan=1 then 1 else 0 end)*100/480,2),'%')as '贷款率' from loan
where online in ('0','1')
group by online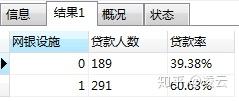
上述结果中显示,使用网银设施的群体贷款率较高。
8、存款账户分析
下面分析存款账户对贷款率的影响
select cd_account as '存款账户', sum(case when personal_loan=1 then 1 else 0 end) as '贷款人数',
