Java通过jfree实现(饼图、折线图、柱状图、折线图-多条、3D柱状图、气泡图、时序图、曲线图、环形图、区域图、分布图、联合分类图、双X轴图、甘特图、K线图、柱状图-横向)生成图片
码奴生来只知道前进
2022-07-29 15:26
1、添加依赖
2、生成图表图片工具类
3、调用测试生成对应的图片
4、生成的图片示例
4.1 饼图
4.2 折线图
4.3 柱状图
4.4 折线图-多条
4.5 生成3D柱状图
4.6 生成气泡图
4.7 生成时序图
4.8 生成曲线图
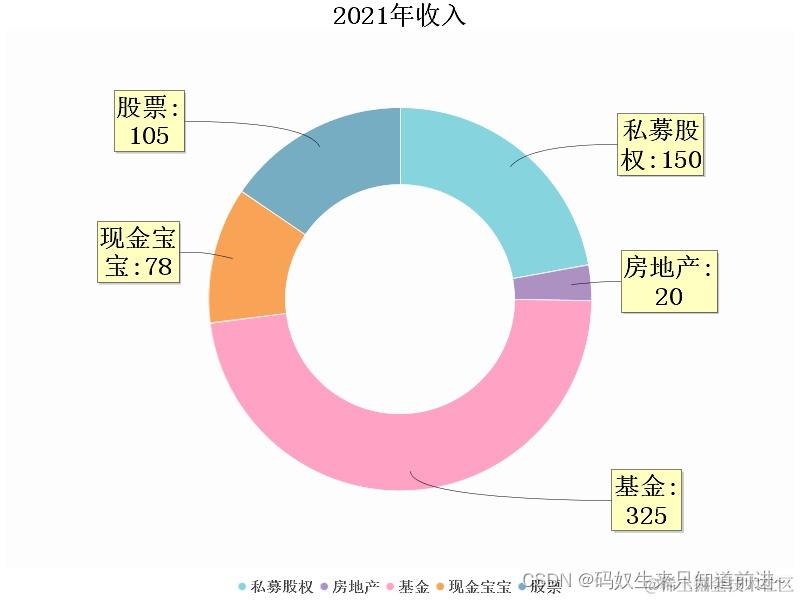
4.9 生成环形图
4.10 生成区域图
4.11 气泡图2
4.12 生成分布图
4.13 生成联合分类图-折线、柱状
4.14 双X轴图
4.15 甘特图
4.16 K线图
4.17 柱状图-横向
1、添加依赖
<dependency>
<groupId>jfree</groupId>
<artifactId>jcommon</artifactId>
<version>1.0.16</version>
</dependency>
<dependency>
<groupId>jfree</groupId>
<artifactId>jfreechart</artifactId>
<version>1.0.13</version>
</dependency>
2、生成图表图片工具类
package com.shucha.deveiface.biz.test;
* @author tqf
* @Description
* @Version 1.0
* @since 2022-06-06 15:32
import cn.hutool.core.collection.CollectionUtil;
import cn.hutool.core.util.StrUtil;
import org.apache.poi.hssf.usermodel.HSSFWorkbook;
import org.apache.poi.ss.usermodel.Cell;
import org.apache.poi.ss.usermodel.CellType;
import org.apache.poi.ss.usermodel.Row;
import org.apache.poi.ss.usermodel.Sheet;
import org.apache.poi.xssf.usermodel.XSSFWorkbook;
import org.jfree.chart.*;
import org.jfree.chart.axis.*;
import org.jfree.chart.block.BlockBorder;
import org.jfree.chart.labels.StandardCategoryItemLabelGenerator;
import org.jfree.chart.labels.StandardPieSectionLabelGenerator;
import org.jfree.chart.labels.StandardXYItemLabelGenerator;
import org.jfree.chart.plot.*;
import org.jfree.chart.renderer.category.*;
import org.jfree.chart.renderer.xy.CandlestickRenderer;
import org.jfree.chart.renderer.xy.XYBarRenderer;
import org.jfree.chart.renderer.xy.XYItemRenderer;
import org.jfree.chart.renderer.xy.XYSplineRenderer;
import org.jfree.chart.title.LegendTitle;
import org.jfree.chart.title.TextTitle;
import org.jfree.data.category.DefaultCategoryDataset;
import org.jfree.data.category.IntervalCategoryDataset;
import org.jfree.data.gantt.Task;
import org.jfree.data.gantt.TaskSeries;
import org.jfree.data.gantt.TaskSeriesCollection;
import org.jfree.data.general.DefaultPieDataset;
import org.jfree.data.general.SeriesException;
import org.jfree.data.time.Day;
import org.jfree.data.time.Second;
import org.jfree.data.time.TimeSeries;
import org.jfree.data.time.TimeSeriesCollection;
import org.jfree.data.time.ohlc.OHLCSeries;
import org.jfree.data.time.ohlc.OHLCSeriesCollection;
import org.jfree.data.xy.*;
import org.jfree.ui.RectangleEdge;
import javax.imageio.ImageIO;
import java.awt.*;
import java.awt.image.BufferedImage;
import java.io.*;
import java.text.NumberFormat;
import java.text.SimpleDateFormat;
import java.util.*;
import java.util.List;
import java.util.Map;
public class JfreeChartUtils {
* 生成的图片存放地址
public static String imagePath = "D://123//jfree";
public static void main(String[] args) throws Exception {
testPie();
testLine();
testBar();
testCreateManyLineChart();
bar3D();
bubble();
sequenceDiagram();
curve();
annular();
areaChart();
bubble2();
chartPanel();
chartPanel1();
biaxial();
createGanttChart();
kImage();
bar3DHx();
public static void testPie(){
Font font = new Font("新宋体", Font.BOLD, 15);
String name[] = {"录播主机","编码器","摄像机","流转码服务器","腾讯服务器"};
double value[] = {1000,700,600,400,150};
Map<String, Double> map=new HashMap<String, Double>();
for (int i=0;i<name.length;i++) {
map.put(name[i],value[i]);
JFreeChart chart = createPieChart("故障设备类型比例", map, font);
File p = new File(imagePath);
if (!p.exists()) {
p.mkdirs();
String imageName = System.currentTimeMillis() + "_饼图" + ".jpeg";
File file = new File(p.getPath() + "/" + imageName);
try {
if(file.exists()) {
file.delete();
ChartUtilities.saveChartAsJPEG(file, chart, 800, 600);
} catch (IOException e) {
e.printStackTrace();
public static void testLine(){
Font font = new Font("新宋体", Font.BOLD, 15);
Map<String, Map<String, Double>> datas =new HashMap<String, Map<String,Double>>();
String monthArray[] = {"一月","二月","三月","四月","五月","六月","七月","八月"};
double value[]= {20,30,25,50,40,25,50,40};
for (int i=0; i<monthArray.length;i++) {
Map<String, Double> map =new HashMap<String, Double>();
map.put("故障数量", value[i]);
datas.put(monthArray[i],map);
JFreeChart chart = createLineChart("故障数量-时间曲线", datas, "月份", "故障次数(次)", font);
File p = new File(imagePath);
if (!p.exists()) {
p.mkdirs();
String imageName = System.currentTimeMillis() + "_折线图" + ".jpeg";
File file = new File(p.getPath() + "/" + imageName);
try {
if(file.exists()) {
file.delete();
ChartUtilities.saveChartAsJPEG(file, chart, 800, 600);
} catch (IOException e) {
e.printStackTrace();
public static void testBar(){
Font font = new Font("新宋体", Font.BOLD, 15);
Map<String, Map<String, Double>> datas =new HashMap<String, Map<String,Double>>();
String name[] = {"设备网络掉线","CPU利用率高","磁盘占用高","掉线频率","内存使用率","访问量"};
double value[] = {1000,1300
,1200,1524,1247,6587};
for (int i =0;i<name.length;i++) {
Map<String, Double> map = new HashMap<String, Double>();
map.put("故障数", value[i]);
datas.put(name[i], map);
JFreeChart chart = createBarChart("故障类型比例",datas,"故障类型","数量单位(个)",font);
File p = new File(imagePath);
if (!p.exists()) {
p.mkdirs();
String imageName = System.currentTimeMillis() + "_柱状图" + ".jpeg";
File file = new File(p.getPath() + "/" + imageName);
try {
if(file.exists()) {
file.delete();
ChartUtilities.saveChartAsJPEG(file, chart, 800, 600);
} catch (IOException e) {
e.printStackTrace();
public static void testCreateManyLineChart(){
String[] title = {"成功量","失败量","异常"};
String[] xValue = {"2021-01","2021-02","2021-03","2021-04","2021-05"};
DefaultCategoryDataset dataSet = new DefaultCategoryDataset();
Random r = new Random();
for (int i =0;i<title.length;i++) {
for (int j=0;j<5;j++) {
int value = r.nextInt(10) * 2;
dataSet.setValue(value,title[i],xValue[j]);
JFreeChart chart = createManyLineChart(dataSet);
File p = new File(imagePath);
if (!p.exists()) {
p.mkdirs();
String imageName = System.currentTimeMillis() + "_多条折线图" + ".jpeg";
File file = new File(p.getPath() + "/" + imageName);
try {
if(file.exists()) {
file.delete();
ChartUtilities.saveChartAsJPEG(file, chart, 800, 600);
} catch (IOException e) {
e.printStackTrace();
static void sortMap(Map<String, Map<String, Double>> param) {
TreeMap<String, Map<String, Double>> paramTreeMap = new TreeMap<>(param);
System.out.println(paramTreeMap);
* 生成饼图
* @param title
* @param data
* @param font
* @return
public static JFreeChart createPieChart(String title, Map<String, Double> data, Font font) {
try {
Set<Map.Entry<String, Double>> set = data.entrySet();
DefaultPieDataset pds = new DefaultPieDataset();
Iterator iterator = set.iterator();
Map.Entry entry;
while (iterator.hasNext()) {
entry = (Map.Entry) iterator.next();
pds.setValue(entry.getKey().toString(), Double.parseDouble(entry.getValue().toString()));
JFreeChart chart = ChartFactory.createPieChart(title, pds, true, false, true);
chart.getTitle().setFont(font);
PiePlot plot = (PiePlot) chart.getPlot();
plot.setLabelFont(font);
chart.getLegend().setItemFont(font);
plot.setForegroundAlpha(0.7f);
plot.setBackgroundAlpha(0.0f);
plot.setLabelGenerator(new StandardPieSectionLabelGenerator("{0}({1})/{2}"));
chart.getLegend().setFrame(new BlockBorder(Color.WHITE));
return chart;
} catch (Exception e) {
e.printStackTrace();
return null;
* 生成折线图
* @param title
* @param data
* @param type
* @param unit
* @param font
* @return
public static JFreeChart createLineChart(String title, Map<String, Map<String, Double>> data, String type, String unit, Font font) {
try {
DefaultCategoryDataset ds = new DefaultCategoryDataset();
Set<Map.Entry<String, Map<String, Double>>> set1 = data.entrySet();
Iterator iterator1 = set1.iterator();
Iterator iterator2;
HashMap<String, Double> map;
Set<Map.Entry<String, Double>> set2;
Map.Entry entry1;
Map.Entry entry2;
while (iterator1.hasNext()) {
entry1 = (Map.Entry) iterator1.next();
map = (HashMap<String, Double>) entry1.getValue();
set2 = map.entrySet();
iterator2 = set2.iterator();
while (iterator2.hasNext()) {
entry2 = (Map.Entry) iterator2.next();
ds.setValue(Double.parseDouble(entry2.getValue().toString()), entry2.getKey().toString(), entry1.getKey().toString());
JFreeChart chart = ChartFactory.createLineChart(title, type, unit, ds, PlotOrientation.VERTICAL, true, true, true);
JFreeChart chart2 = ChartFactory.createLineChart3D(title, type, unit, ds, PlotOrientation.VERTICAL, true, true, false);
chart.getTitle().setFont(font);
font = new Font("宋体", Font.BOLD, 15);
chart.getLegend().setItemFont(font);
CategoryPlot plot = (CategoryPlot) chart.getPlot();
plot.getDomainAxis().setLabelFont(font);
plot.setBackgroundAlpha(0.1f);
plot.setRangeGridlinePaint(Color.gray);
plot.setDomainGridlineStroke(new BasicStroke(0.2F));
plot.setRangeGridlineStroke(new BasicStroke(0.2F));
plot.getDomainAxis().setTickLabelFont(font);
LineAndShapeRenderer lineAndShapeRenderer=(LineAndShapeRenderer)plot.getRenderer();
lineAndShapeRenderer.setBaseItemLabelGenerator(new StandardCategoryItemLabelGenerator());
lineAndShapeRenderer.setBaseItemLabelsVisible(true);
lineAndShapeRenderer.setBaseItemLabelFont(new Font("宋体",Font.BOLD,15));
Rectangle shape=new Rectangle(4,4);
lineAndShapeRenderer.setSeriesShape(0, shape);
lineAndShapeRenderer.setSeriesShapesVisible(0, true);
font = new Font("宋体", Font.BOLD, 18);
plot.getRangeAxis().setLabelFont(font);
return chart;
} catch (Exception e) {
e.printStackTrace();
return null;
* 生成折线图 多条
* @return
public static JFreeChart createManyLineChart(DefaultCategoryDataset dataSet){
JFreeChart chart = ChartFactory.createLineChart("图表标题", "X轴标题", "Y轴标题", dataSet,
PlotOrientation.VERTICAL,
true,
true,
false
Font font = new Font("新宋体", Font.BOLD, 15);
chart.getTitle().setFont(font);
chart.getLegend().setItemFont(font);
CategoryPlot plot = chart.getCategoryPlot();
plot.setBackgroundPaint(Color.LIGHT_GRAY);
plot.setRangeGridlinePaint(Color.gray);
plot.setBackgroundAlpha(0.1f);
plot.setRangeGridlinePaint(Color.gray);
plot.setDomainGridlineStroke(new BasicStroke(0.2F));
plot.setRangeGridlineStroke(new BasicStroke(0.2F));
plot.setRangeGridlinesVisible(true);
plot.setDomainGridlinePaint(Color.WHITE);
plot.setDomainGridlinesVisible(true);
CategoryAxis domainAxis = plot.getDomainAxis();
domainAxis.setLabelFont(font);
domainAxis.setTickLabelFont(font);
domainAxis.setLowerMargin(0.01);
domainAxis.setUpperMargin(0.06);
domainAxis.setMaximumCategoryLabelLines(2);
ValueAxis rangeAxis = plot.getRangeAxis();
rangeAxis.setLabelFont(font);
rangeAxis.setStandardTickUnits(NumberAxis.createIntegerTickUnits());
rangeAxis.setAutoRangeMinimumSize(1);
rangeAxis.setUpperMargin(0.18);
rangeAxis.setLowerBound(0);
rangeAxis.setAutoRange(false);
rangeAxis.setTickMarkStroke(new BasicStroke(1.6f));
rangeAxis.setTickMarkPaint(Color.BLACK);
LineAndShapeRenderer renderer = (LineAndShapeRenderer) plot.getRenderer();
BasicStroke realLine = new BasicStroke(1.8f);
float dashes[] = { 5.0f };
BasicStroke brokenLine = new BasicStroke(2.2f,
BasicStroke.CAP_ROUND,
BasicStroke.JOIN_ROUND,
8f, dashes, 0.6f);
for (int i = 0; i < dataSet.getRowCount(); i++) {
if (i % 2 == 0) {
renderer.setSeriesStroke(i, realLine);
} else {
renderer.setSeriesStroke(i, brokenLine);
renderer.setBaseItemLabelGenerator(new StandardCategoryItemLabelGenerator());
renderer.setBaseItemLabelsVisible(true);
renderer.setBaseItemLabelFont(new Font("宋体",Font.BOLD,15));
Rectangle shape=new Rectangle(4,4);
renderer.setSeriesShape(0, shape);
renderer.setSeriesShapesVisible(0, true);
plot.setNoDataMessage("无对应的数据,请重新查询。");
plot.setNoDataMessageFont(font);
plot.setNoDataMessagePaint(Color.RED);
return chart;
* 生成柱状图
* @param title
* @param data
* @param type
* @param danwei
* @param font
* @return
public static JFreeChart createBarChart(String title,Map<String,Map<String,Double>> data,String type,String danwei,Font font){
try {
DefaultCategoryDataset ds = new DefaultCategoryDataset();
Set<Map.Entry<String, Map<String, Double>>> set1 = data.entrySet();
Iterator iterator1= set1.iterator();
Iterator iterator2;
HashMap<String, Double> map;
Set<Map.Entry<String,Double>> set2;
Map.Entry entry1;
Map.Entry entry2;
while(iterator1.hasNext()){
entry1=(Map.Entry) iterator1.next();
map=(HashMap<String, Double>) entry1.getValue();
set2=map.entrySet();
iterator2=set2.iterator();
while (iterator2.hasNext()) {
entry2= (Map.Entry) iterator2.next();
ds.setValue(Double.parseDouble(entry2.getValue().toString()), entry2.getKey().toString(), entry1.getKey().toString());
JFreeChart chart = ChartFactory.createBarChart(title, type, danwei, ds, PlotOrientation.VERTICAL, true, true, true);
chart.getTitle().setFont(font);
font = new Font("宋体", Font.BOLD, 15);
chart.getLegend().setItemFont(font);
CategoryPlot plot = (CategoryPlot) chart.getPlot();
plot.getDomainAxis().setLabelFont(font);
plot.setBackgroundAlpha(0.1f);
plot.setRangeGridlinePaint(Color.gray);
plot.setDomainGridlineStroke(new BasicStroke(0.2F));
plot.setRangeGridlineStroke(new BasicStroke(0.2F));
plot.getDomainAxis().setTickLabelFont(font);
CategoryPlot categoryPlot = chart.getCategoryPlot();
BarRenderer rendererBar = (BarRenderer) categoryPlot.getRenderer();
rendererBar.setMaximumBarWidth(0.05);
rendererBar.setSeriesPaint(0, Color.decode("#005AB5"));
rendererBar.setBaseItemLabelsVisible(true);
rendererBar.setSeriesItemLabelFont(0,font);
plot.getRangeAxis().setLabelFont(font);
plot.setForegroundAlpha(1.0f);
return chart;
} catch (Exception e) {
e.printStackTrace();
return null;
* 生成3D柱状图
public static void bar3D() {
String seriesArray[] = {"菲亚特","奥迪","福特"};
String categoryArray[] = {"速度","喜欢程度","邮寄","用户评价","安全性","使用性"};
int value[] = {310,489,512,589,359,402,501,200,308,580,418,315,480,381,264,185,209,302};
DefaultCategoryDataset dataset = new DefaultCategoryDataset();
int data = 0;
for (int i=0;i<3;i++) {
for (int j = 0; j < 6; j++) {
dataset.addValue(value[data], seriesArray[i], categoryArray[j]);
data++;
StandardChartTheme sct = new StandardChartTheme("CN");
sct.setExtraLargeFont(new Font("宋体", Font.LAYOUT_LEFT_TO_RIGHT, 15));
sct.setRegularFont(new Font("宋体", Font.LAYOUT_LEFT_TO_RIGHT, 15));
sct.setLargeFont(new Font("宋体", Font.LAYOUT_LEFT_TO_RIGHT, 15));
ChartFactory.setChartTheme(sct);
JFreeChart chart = ChartFactory.createBarChart3D(
"汽车使用统计",
"",
"",
dataset,
PlotOrientation.VERTICAL,
true, true, false);
CategoryPlot plot = (CategoryPlot) chart.getPlot();
int width = 640;
int height = 480;
chart.getLegend().setPosition(RectangleEdge.TOP);
chart.getLegend().setFrame(new BlockBorder(Color.WHITE));
File p = new File
(imagePath);
if (!p.exists()) {
p.mkdirs();
String imageName = System.currentTimeMillis() + "_3D柱状图" + ".jpeg";
File file = new File(p.getPath() + "/" + imageName);
try {
if(file.exists()) {
file.delete();
ChartUtilities.saveChartAsJPEG(file, chart, width, height);
} catch (IOException e) {
e.printStackTrace();
* 生成气泡图
public static void bubble() {
DefaultXYZDataset defaultxyzdataset = new DefaultXYZDataset( );
double ad[ ] = { 30 , 40 , 50 , 60 , 70 , 80 };
double ad1[ ] = { 10 , 20 , 30 , 40 , 50 , 60 };
double ad2[ ] = { 4 , 5 , 10 , 8 , 9 , 6 };
double ad3[ ][ ] = { ad , ad1 , ad2 };
defaultxyzdataset.addSeries( "系统1" , ad3 );
JFreeChart jfreechart = ChartFactory.createBubbleChart(
"年龄、体重和工作",
"重量",
"年龄",
defaultxyzdataset,
PlotOrientation.HORIZONTAL,
true, true, false);
XYPlot xyplot = ( XYPlot )jfreechart.getPlot();
xyplot.setForegroundAlpha( 0.65F );
XYItemRenderer xyitemrenderer = xyplot.getRenderer( );
xyitemrenderer.setSeriesPaint( 0 , Color.blue );
NumberAxis numberaxis = ( NumberAxis )xyplot.getDomainAxis( );
numberaxis.setLowerMargin( 0.2 );
numberaxis.setUpperMargin( 0.5 );
NumberAxis numberAxis = ( NumberAxis )xyplot.getRangeAxis( );
numberAxis.setLowerMargin( 0.8 );
numberAxis.setUpperMargin( 0.9 );
int width = 560;
int height = 370;
File p = new File(imagePath);
if (!p.exists()) {
p.mkdirs();
String imageName = System.currentTimeMillis() + "_气泡图" + ".jpeg";
File file = new File(p.getPath() + "/" + imageName);
try {
if(file.exists()) {
file.delete();
ChartUtilities.saveChartAsJPEG(file, jfreechart, width, height);
} catch (IOException e) {
e.printStackTrace();
* 生成时序图
public static void sequenceDiagram(){
final TimeSeries series = new TimeSeries( "Random Data" );
Second current = new Second();
double value = 100.0;
for ( int i = 0 ; i < 4000 ; i++ )
try {
value = value + Math.random( ) - 0.5;
series.add( current , new Double( value ) );
current = ( Second ) current.next( );
} catch ( SeriesException e ) {
System.err.println( "Error adding to series" );
final XYDataset dataset=( XYDataset )new TimeSeriesCollection(series);
JFreeChart timeChart = ChartFactory.createTimeSeriesChart(
"计算测试",
"秒数",
"值",
dataset,
false,
false,
false);
int width = 560;
int height = 370;
File p = new File(imagePath);
if (!p.exists()) {
p.mkdirs();
String imageName = System.currentTimeMillis() + "_时序图" + ".jpeg";
File file = new File(p.getPath() + "/" + imageName);
try {
if(file.exists()) {
file.delete();
ChartUtilities.saveChartAsJPEG(file, timeChart, width, height);
} catch (IOException e) {
e.printStackTrace();
* 生成曲线图
public static void curve(){
Font font = new Font("宋体", Font.BOLD, 25);
XYSeries series = new XYSeries("2020年");
series.add(01, 3542);
series.add(02, 3692);
series.add(03, 8542);
series.add(04, 5742);
XYSeries series1 = new XYSeries("2021年");
series1.add(01, 1242);
series1.add(02, 2612);
series1.add(03, 1942);
series1.add(04, 4612);
XYSeriesCollection xySeriesCollection = new XYSeriesCollection();
xySeriesCollection.addSeries(series);
xySeriesCollection.addSeries(series1);
StandardChartTheme standardChartTheme = new StandardChartTheme("CN");
standardChartTheme.setExtraLargeFont(font);
standardChartTheme.setRegularFont(font);
standardChartTheme.setLargeFont(font);
standardChartTheme.setChartBackgroundPaint(Color.WHITE);
ChartFactory.setChartTheme(standardChartTheme);
JFreeChart chart = ChartFactory.createXYLineChart("年度绩效", "季度", "销售额", xySeriesCollection,
PlotOrientation.VERTICAL, true, true, false);
XYPlot plot = (XYPlot)chart.getPlot();
plot.setOutlineVisible(false);
plot.setOutlinePaint(Color.WHITE);
plot.setBackgroundPaint(Color.WHITE);
plot.setNoDataMessage("无图表数据");
plot.setNoDataMessageFont(font);
plot.setNoDataMessagePaint(Color.RED);
LegendTitle legend = chart.getLegend();
legend.setPosition(RectangleEdge.BOTTOM);
legend.setVisible(true);
legend.setBorder(BlockBorder.NONE);
legend.setItemFont(font);
plot.setDomainGridlinePaint(Color.BLUE);
plot.setDomainGridlinesVisible(true);
plot.setRangeGridlinePaint(Color.BLACK);
plot.setRangeGridlinesVisible(true);
NumberAxis xAxis = (NumberAxis)plot.getDomainAxis();
xAxis.setTickLabelFont(font);
xAxis.setLabelFont(font);
xAxis.setTickLabelFont(font);
xAxis.setAxisLineStroke(new BasicStroke(2f));
xAxis.setAxisLinePaint(Color.BLACK);
xAxis.setLowerMargin(0.03D);
xAxis.setUpperMargin(0.03D);
xAxis.setTickUnit(new NumberTickUnit(1D));
ValueAxis yAxis = plot.getRangeAxis();
yAxis.setTickLabelFont(font);
yAxis.setLabelFont(font);
yAxis.setAxisLineStroke(new BasicStroke(1f));
yAxis.setAxisLinePaint(Color.BLACK);
yAxis.setUpperMargin(0.18D);
yAxis.setLowerMargin(0.1D);
XYSplineRenderer renderer = new XYSplineRenderer();
renderer.setItemLabelGenerator(new StandardXYItemLabelGenerator());
renderer.setBaseItemLabelsVisible(true);
renderer.setBaseShapesVisible(true);
renderer.setShapesFilled(Boolean.TRUE);
renderer.setShapesVisible(true);
renderer.setItemLabelFont(font);
renderer.setStroke(new BasicStroke(4f));
plot.setRenderer(renderer);
int width = 1800;
int height = 800;
File p = new File(imagePath);
if (!p.exists()) {
p.mkdirs();
String imageName = System.currentTimeMillis() + "_曲线图" + ".jpeg";
File file = new File(p.getPath() + "/" + imageName);
try {
if(file.exists()) {
file.delete();
ChartUtilities.saveChartAsJPEG(file, chart, width, height);
} catch (IOException e) {
e.printStackTrace();
* 生成环形图
public static void annular(){
DefaultPieDataset dataSet = new DefaultPieDataset();
int i, j;
String[] key = { "私募股权","房地产","基金","现金宝宝","股票" };
int[] value = { 150, 20, 325, 78, 105 };
for (i = 0, j = 0; i < key.length && j < value.length; i++, j++) {
dataSet.setValue(key[i], value[j]);
JFreeChart chart = ChartFactory.createRingChart("2021年收入", dataSet, true, false, false);
chart.getLegend().setVisible(true);
Font font = new Font("宋体", Font.BOLD, 15);
chart.getLegend().setItemFont(font);
chart.getLegend().setFrame(new BlockBorder(Color.WHITE));
RingPlot ringplot = (RingPlot) chart.getPlot();
ringplot.setOutlineVisible(false);
ringplot.setLabelGenerator(new StandardPieSectionLabelGenerator("{0}:{1}"));
ringplot.setBackgroundPaint(new Color(253,253,253));
ringplot.setOutlineVisible(false);
ringplot.setSectionOutlinePaint(Color.WHITE);
ringplot.setSeparatorsVisible(true);
ringplot.setSeparatorPaint(Color.WHITE);
ringplot.setShadowPaint(new Color(253,253,253));
ringplot.setSectionDepth(0.4);
ringplot.setStartAngle(90);
ringplot.setDrawingSupplier(new DefaultDrawingSupplier(
new Paint[] {
new Color(134, 212, 222),
new Color(174, 145, 195),
new Color(255, 162, 195),
new Color(249, 163, 86),
new Color(119, 173, 195)
DefaultDrawingSupplier.DEFAULT_OUTLINE_PAINT_SEQUENCE,
DefaultDrawingSupplier.DEFAULT_STROKE_SEQUENCE,
DefaultDrawingSupplier.DEFAULT_OUTLINE_STROKE_SEQUENCE,
DefaultDrawingSupplier.DEFAULT_SHAPE_SEQUENCE));
int width = 800;
int height = 600;
File p = new File(imagePath);
if (!p.exists()) {
p.mkdirs();
String imageName = System.currentTimeMillis() + "_环形图" + ".jpeg";
File file = new File(p.getPath() + "/" + imageName);
try {
if(file.exists()) {
file.delete();
ChartUtilities.saveChartAsJPEG(file, chart, width, height);
} catch (IOException e) {
e.printStackTrace();
* 生成区域图
public static void areaChart(){
String seriesArray[] = {"JAVA图书","Android图书","PHP图书"};
String categoryArray[] = {"1月","2月","3月","4月","5月","6月"};
int value[] = {310,489,512,589,359,402,501,200,308,580,418,315,480,381,264,185,209,302};
DefaultCategoryDataset dataset = new DefaultCategoryDataset();
int data = 0;
for (int i=0;i<3;i++) {
for (int j = 0; j < 6; j++) {
dataset.addValue(value[data], seriesArray[i], categoryArray[j]);
data++;
JFreeChart chart = ChartFactory.createAreaChart(
"2018年上半年销售量",
"月份",
"销售量(单位:本)",
dataset,
PlotOrientation.VERTICAL,
true,
false,
false
Font font = new Font("宋体", Font.BOLD, 15);
TextTitle textTitle = chart.getTitle();
textTitle.setFont(new Font("宋体", Font.PLAIN, 20));
LegendTitle legendTitle = chart.getLegend();
legendTitle.setItemFont(new Font("宋体", Font.PLAIN, 14));
CategoryPlot categoryPlot = chart.getCategoryPlot();
CategoryAxis categoryAxis = categoryPlot.getDomainAxis();
categoryAxis.setTickLabelFont(font);
categoryAxis.setLabelFont(font);
ValueAxis valueAxis = categoryPlot.getRangeAxis();
valueAxis.setTickLabelFont(font);
valueAxis.setLabelFont(font);
categoryPlot.setForegroundAlpha(0.5f);
CategoryPlot plot = (CategoryPlot) chart.getPlot();
plot.getDomainAxis().setLabelFont(font);
plot.setBackgroundAlpha(0.1f);
plot.setRangeGridlinePaint(Color.gray);
plot.setDomainGridlineStroke(new BasicStroke(0.2F));
plot.setRangeGridlineStroke(new BasicStroke(0.2F));
chart.getLegend().setItemFont(font);
chart.getLegend().setFrame(new BlockBorder(Color.WHITE));
int width = 800;
int height = 600;
File p = new File(imagePath);
if (!p.exists()) {
p.mkdirs();
String imageName = System.currentTimeMillis() + "_区域图" + ".jpeg";
File file = new File(p.getPath() + "/" + imageName);
try {
if(file.exists()) {
file.delete();
ChartUtilities.saveChartAsJPEG(file, chart, width, height);
} catch (IOException e) {
e.printStackTrace();
* 生成气泡图2
public static void bubble2(){
String seriesArray[] = {"JAVA图书","Android图书","PHP图书"};
DefaultXYZDataset dataset = new DefaultXYZDataset();
double data1[][] = new double[][] { { 600 }, { 10 }, { 600 / (10 * 10) } };
double data2[][] = new double[][] { { 650 }, { 10 }, { 650 / (10 * 10
) } };
double data3[][] = new double[][] { { 800 }, { 16 }, { 800 / (16 * 10) } };
for (int i=0;i<seriesArray.length;i++) {
dataset.addSeries(seriesArray[i], i == 0 ? data1: i==1 ? data2:data3);
JFreeChart chart = ChartFactory.createBubbleChart(
"2018年上半年销售量",
"页数",
"章数",
dataset,
PlotOrientation.VERTICAL,
true,
false,
false
Font font = new Font("宋体", Font.BOLD, 15);
TextTitle textTitle = chart.getTitle();
textTitle.setFont(new Font("宋体", Font.PLAIN, 20));
LegendTitle legendTitle = chart.getLegend();
legendTitle.setItemFont(new Font("宋体", Font.PLAIN, 14));
XYPlot plot = chart.getXYPlot();
NumberAxis domainAxis = (NumberAxis) plot.getDomainAxis();
domainAxis.setLabelFont(new Font("宋体", Font.PLAIN, 14));
NumberAxis rangeAxis = (NumberAxis) plot.getRangeAxis();
rangeAxis.setLabelFont(new Font("宋体", Font.PLAIN, 14));
plot.setForegroundAlpha(0.4f);
plot.setBackgroundAlpha(0.1f);
plot.setRangeGridlinePaint(Color.gray);
chart.getLegend().setItemFont(font);
chart.getLegend().setFrame(new BlockBorder(Color.WHITE));
int width = 800;
int height = 600;
File p = new File(imagePath);
if (!p.exists()) {
p.mkdirs();
String imageName = System.currentTimeMillis() + "_气泡图2" + ".jpeg";
File file = new File(p.getPath() + "/" + imageName);
try {
if(file.exists()) {
file.delete();
ChartUtilities.saveChartAsJPEG(file, chart, width, height);
} catch (IOException e) {
e.printStackTrace();
* 生成分布图
public static void chartPanel(){
String seriesArray[] = {"JAVA图书","Android图书","PHP图书"};
String categoryArray[] = {"1月","2月","3月","4月","5月","6月"};
int value[] = {310,489,512,589,359,402,501,200,308,580,418,315,480,381,264,185,209,302};
DefaultCategoryDataset dataset = new DefaultCategoryDataset();
int data = 0;
for (int i=0;i<3;i++) {
for (int j = 0; j < 6; j++) {
dataset.addValue(value[data], seriesArray[i], categoryArray[j]);
data++;
CategoryItemRenderer renderer = new CategoryStepRenderer(true);
renderer.setSeriesStroke(0, new BasicStroke(5));
CategoryAxis domainAxis = new CategoryAxis("月份");
domainAxis.setTickLabelFont(new Font("宋体", Font.PLAIN, 14));
domainAxis.setLabelFont(new Font("宋体", Font.PLAIN, 14));
ValueAxis rangeAxis = new NumberAxis("销售量(单位:本)");
rangeAxis.setTickLabelFont(new Font("宋体", Font.PLAIN, 14));
rangeAxis.setLabelFont(new Font("宋体", Font.PLAIN, 14));
CategoryPlot plot = new CategoryPlot(dataset, domainAxis, rangeAxis, renderer);
JFreeChart chart = new JFreeChart("2018年上半年销售量", plot);
TextTitle textTitle = chart.getTitle();
textTitle.setFont(new Font("宋体", Font.PLAIN, 20));
LegendTitle legendTitle = chart.getLegend();
legendTitle.setItemFont(new Font("宋体", Font.PLAIN, 14));
Font font = new Font("宋体", Font.BOLD, 15);
plot.getDomainAxis().setLabelFont(font);
plot.setBackgroundAlpha(0.1f);
plot.setRangeGridlinePaint(Color.gray);
plot.setDomainGridlineStroke(new BasicStroke(0.2F));
plot.setRangeGridlineStroke(new BasicStroke(0.2F));
chart.getLegend().setItemFont(font);
chart.getLegend().setFrame(new BlockBorder(Color.WHITE));
int width = 800;
int height = 600;
File p = new File(imagePath);
if (!p.exists()) {
p.mkdirs();
String imageName = System.currentTimeMillis() + "_分布图" + ".jpeg";
File file = new File(p.getPath() + "/" + imageName);
try {
if(file.exists()) {
file.delete();
ChartUtilities.saveChartAsJPEG(file, chart, width, height);
} catch (IOException e) {
e.printStackTrace();
* 联合分类图 折线、柱状
public static void chartPanel1(){
String seriesArray[] = {"JAVA图书","Android图书","PHP图书"};
String categoryArray[] = {"1月","2月","3月","4月","5月","6月"};
int value[] = {310,489,512,589,359,402,501,200,308,580,418,315,480,381,264,185,209,302};
DefaultCategoryDataset dataset = new DefaultCategoryDataset();
int data = 0;
for (int i=0;i<3;i++) {
for (int j = 0; j < 6; j++) {
dataset.addValue(value[data], seriesArray[i], categoryArray[j]);
data++;
LineAndShapeRenderer renderer1 = new LineAndShapeRenderer();
BarRenderer renderer2 = new BarRenderer();
AreaRenderer renderer3 = new AreaRenderer();
CategoryAxis domainAxis = new CategoryAxis("月份");
NumberAxis rangeAxis
= new NumberAxis("销售量(单位:本)");
rangeAxis.setLabelFont(new Font("黑体",Font.PLAIN,12));
rangeAxis.setLabelPaint(Color.BLUE) ;
rangeAxis.setTickLabelFont(new Font("黑体",Font.PLAIN,12));
CategoryPlot plot1 = new CategoryPlot(dataset, domainAxis, rangeAxis, renderer1);
CategoryPlot plot2 = new CategoryPlot(dataset, domainAxis, rangeAxis, renderer2);
CategoryPlot plot3 = new CategoryPlot(dataset, domainAxis, rangeAxis, renderer3);
CombinedDomainCategoryPlot plot = new CombinedDomainCategoryPlot(domainAxis);
plot.add(plot1);
plot.add(plot2);
JFreeChart chart = new JFreeChart("2018年上半年销售量", plot);
TextTitle textTitle = chart.getTitle();
textTitle.setFont(new Font("宋体", Font.PLAIN, 20));
LegendTitle legendTitle = chart.getLegend();
legendTitle.setItemFont(new Font("宋体", Font.PLAIN, 14));
CategoryPlot categoryPlot = chart.getCategoryPlot();
CategoryAxis categoryAxis = categoryPlot.getDomainAxis();
categoryAxis.setTickLabelFont(new Font("宋体", Font.PLAIN, 14));
categoryAxis.setLabelFont(new Font("宋体", Font.PLAIN, 14));
chart.getLegend().setFrame(new BlockBorder(Color.WHITE));
int width = 800;
int height = 600;
File p = new File(imagePath);
if (!p.exists()) {
p.mkdirs();
String imageName = System.currentTimeMillis() + "_联合分类图" + ".jpeg";
File file = new File(p.getPath() + "/" + imageName);
try {
if(file.exists()) {
file.delete();
ChartUtilities.saveChartAsJPEG(file, chart, width, height);
} catch (IOException e) {
e.printStackTrace();
* 双轴图
public static void biaxial(){
String seriesArray[] = {"JAVA图书","Android图书","PHP图书"};
String categoryArray[] = {"1月","2月","3月","4月","5月","6月"};
int value[] = {310,489,512,589,359,402,501,200,308,580,418,315,480,381,264,185,209,302};
String lineArray[] = {"C++图书","C#图书","GO图书"};
DefaultCategoryDataset columnarDataset = new DefaultCategoryDataset();
int data = 0;
for (int i=0;i<seriesArray.length;i++) {
for (int j = 0; j < 6; j++) {
columnarDataset.addValue(value[data], seriesArray[i], categoryArray[j]);
data++;
DefaultCategoryDataset lineDataset = new DefaultCategoryDataset();
data = 0;
for (int i=0;i<lineArray.length;i++) {
for (int k = 0; k < 6; k++) {
lineDataset.addValue(value[data], lineArray[i], categoryArray[k]);
data++;
JFreeChart chart = ChartFactory.createBarChart(
"2018年上半年销售量",
"月份",
"销售量(单位:本)",
columnarDataset,
PlotOrientation.VERTICAL,
true,
false,
false
TextTitle textTitle = chart.getTitle();
textTitle.setFont(new Font("宋体", Font.PLAIN, 20));
LegendTitle legendTitle = chart.getLegend();
legendTitle.setItemFont(new Font("宋体", Font.PLAIN, 14));
CategoryPlot categoryPlot = chart.getCategoryPlot();
CategoryAxis categoryAxis = categoryPlot.getDomainAxis();
categoryAxis.setTickLabelFont(new Font("宋体", Font.PLAIN, 14));
categoryAxis.setLabelFont(new Font("宋体", Font.PLAIN, 14));
ValueAxis valueAxis = categoryPlot.getRangeAxis();
valueAxis.setTickLabelFont(new Font("宋体", Font.PLAIN, 14));
valueAxis.setLabelFont(new Font("宋体", Font.PLAIN, 14));
categoryPlot.setDataset(1, lineDataset);
LineAndShapeRenderer renderer2 = new LineAndShapeRenderer();
categoryPlot.setRenderer(1, renderer2);
ValueAxis axis2 = new NumberAxis("网购销售量");
axis2.setUpperBound(200);
categoryPlot.setRangeAxis(1, axis2);
chart.getLegend().setFrame(new BlockBorder(Color.WHITE));
categoryPlot.setBackgroundAlpha(0.1f);
categoryPlot.setRangeGridlinePaint(Color.gray);
categoryPlot.setDomainGridlineStroke(new BasicStroke(0.2F));
categoryPlot.setRangeGridlineStroke(new BasicStroke(0.2F));
int width = 800;
int height = 600;
File p = new File(imagePath);
if (!p.exists()) {
p.mkdirs();
String imageName = System.currentTimeMillis() + "_双轴图" + ".jpeg";
File file = new File(p.getPath() + "/" + imageName);
try {
if(file.exists()) {
file.delete();
ChartUtilities.saveChartAsJPEG(file, chart, width, height);
} catch (IOException e) {
e.printStackTrace();
* 生成甘特图
public static void createGanttChart(){
IntervalCategoryDataset dataset = createSampleDataset();
JFreeChart chart = ChartFactory.createGanttChart("任务管理系统",
"任务各阶段详细实施计划",
"任务周期",
dataset,
true,
false,
false);
CategoryPlot plot=chart.getCategoryPlot();
chart.getTitle().setFont(new Font("宋体",Font.BOLD,20));
CategoryAxis domainAxis=plot.getDomainAxis();
domainAxis.setLabelFont(new Font("宋体",Font.BOLD,15
));
domainAxis.setTickLabelFont(new Font("宋体",Font.BOLD,15));
ValueAxis rangeAxis = plot.getRangeAxis();
rangeAxis.setLabelFont(new Font("宋体",Font.BOLD,16));
DateAxis da = (DateAxis)plot.getRangeAxis(0);
da.setDateFormatOverride(new SimpleDateFormat("yyyy-MM-dd"));
chart.getLegend().setFrame(new BlockBorder(Color.WHITE));
Font font = new Font("宋体", Font.BOLD, 15);
plot.setBackgroundAlpha(0.1f);
plot.setRangeGridlinePaint(Color.gray);
plot.setDomainGridlineStroke(new BasicStroke(0.2F));
plot.setRangeGridlineStroke(new BasicStroke(0.2F));
int width = 800;
int height = 600;
File p = new File(imagePath);
if (!p.exists()) {
p.mkdirs();
String imageName = System.currentTimeMillis() + "_甘特图" + ".jpeg";
File file = new File(p.getPath() + "/" + imageName);
try {
if(file.exists()) {
file.delete();
ChartUtilities.saveChartAsJPEG(file, chart, width, height,null);
} catch (IOException e) {
e.printStackTrace();
* 生成K线图
public static void kImage(){
SimpleDateFormat dateFormat = new SimpleDateFormat("yyyy-MM-dd");
double highValue = Double.MIN_VALUE;
double minValue = Double.MAX_VALUE;
double high2Value = Double.MIN_VALUE;
double min2Value = Double.MAX_VALUE;
OHLCSeries series = new OHLCSeries("");
series.add(new Day(28, 9, 2007), 9.2, 9.58, 9.16, 9.34);
series.add(new Day(27, 9, 2007), 8.9, 9.06, 8.83, 8.96);
series.add(new Day(26, 9, 2007), 9.0, 9.1, 8.82, 9.04);
series.add(new Day(25, 9, 2007), 9.25, 9.33, 8.88, 9.00);
series.add(new Day(24, 9, 2007), 9.05, 9.50, 8.91, 9.25);
series.add(new Day(21, 9, 2007), 8.68, 9.05, 8.40, 9.00);
series.add(new Day(20, 9, 2007), 8.68, 8.95, 8.50, 8.69);
series.add(new Day(19, 9, 2007), 8.80, 8.94, 8.50, 8.66);
series.add(new Day(18, 9, 2007), 8.88, 9.17, 8.69, 8.80);
series.add(new Day(17, 9, 2007), 8.26, 8.98, 8.15, 8.89);
series.add(new Day(14, 9, 2007), 8.44, 8.45, 8.13, 8.33);
series.add(new Day(13, 9, 2007), 8.13, 8.46, 7.97, 8.42);
series.add(new Day(12, 9, 2007), 8.2, 8.4, 7.81, 8.13);
series.add(new Day(11, 9, 2007), 9.0, 9.0, 8.1, 8.24);
series.add(new Day(10, 9, 2007), 8.6, 9.03, 8.40, 8.95);
series.add(new Day(7, 9, 2007), 8.89, 9.04, 8.70, 8.73);
series.add(new Day(6, 9, 2007), 8.4, 9.08, 8.33, 8.88);
series.add(new Day(5, 9, 2007), 8.2, 8.74, 8.17, 8.36);
series.add(new Day(4, 9, 2007), 7.7, 8.46, 7.67, 8.27);
series.add(new Day(3, 9, 2007), 7.5, 7.8, 7.48, 7.69);
series.add(new Day(31, 8, 2007), 7.4, 7.6, 7.28, 7.43);
series.add(new Day(30, 8, 2007), 7.42, 7.56, 7.31, 7.40);
series.add(new Day(29, 8, 2007), 7.42, 7.66, 7.22, 7.33);
series.add(new Day(28, 8, 2007), 7.31, 7.70, 7.15, 7.56);
series.add(new Day(27, 8, 2007), 7.05, 7.46, 7.02, 7.41);
series.add(new Day(24, 8, 2007), 7.05, 7.09, 6.90, 6.99);
series.add(new Day(23, 8, 2007), 7.12, 7.16, 7.00, 7.03);
series.add(new Day(22, 8, 2007), 6.96, 7.15, 6.93, 7.11);
series.add(new Day(21, 8, 2007), 7.10, 7.15, 7.02, 7.07);
series.add(new Day(20, 8, 2007), 7.02, 7.19, 6.94, 7.14);
final OHLCSeriesCollection seriesCollection = new OHLCSeriesCollection();
seriesCollection.addSeries(series);
TimeSeries series2=new TimeSeries("");
series2.add(new Day(28, 9, 2007), 260659400/100);
series2.add(new Day(27, 9, 2007), 119701900/100);
series2.add(new Day(26, 9, 2007), 109719000/100);
series2.add(new Day(25, 9, 2007), 178492400/100);
series2.add(new Day(24, 9, 2007), 269978500
/100);
series2.add(new Day(21, 9, 2007), 361042300/100);
series2.add(new Day(20, 9, 2007), 173912600/100);
series2.add(new Day(19, 9, 2007), 154622600/100);
series2.add(new Day(18, 9, 2007), 200661600/100);
series2.add(new Day(17, 9, 2007), 312799600/100);
series2.add(new Day(14, 9, 2007), 141652900/100);
series2.add(new Day(13, 9, 2007), 221260400/100);
series2.add(new Day(12, 9, 2007), 274795400/100);
series2.add(new Day(11, 9, 2007), 289287300/100);
series2.add(new Day(10, 9, 2007), 289063600/100);
series2.add(new Day(7, 9, 2007), 351575300/100);
series2.add(new Day(6, 9, 2007), 451357300/100);
series2.add(new Day(5, 9, 2007), 442421200/100);
series2.add(new Day(4, 9, 2007), 671942600/100);
series2.add(new Day(3, 9, 2007), 349647800/100);
series2.add(new Day(31, 8, 2007), 225339300/100);
series2.add(new Day(30, 8, 2007), 160048200/100);
series2.add(new Day(29, 8, 2007), 247341700/100);
series2.add(new Day(28, 8, 2007), 394975400/100);
series2.add(new Day(27, 8, 2007), 475797500/100);
series2.add(new Day(24, 8, 2007), 297679500/100);
series2.add(new Day(23, 8, 2007), 191760600/100);
series2.add(new Day(22, 8, 2007), 232570200/100);
series2.add(new Day(21, 8, 2007), 215693200/100);
series2.add(new Day(20, 8, 2007), 200287500/100);
TimeSeriesCollection timeSeriesCollection=new TimeSeriesCollection();
timeSeriesCollection.addSeries(series2);
int seriesCount = seriesCollection.getSeriesCount();
for (int i = 0; i < seriesCount; i++) {
int itemCount = seriesCollection.getItemCount(i);
for (int j = 0; j < itemCount; j++) {
if (highValue < seriesCollection.getHighValue(i, j)) {
highValue = seriesCollection.getHighValue(i, j);
if (minValue > seriesCollection.getLowValue(i, j)) {
minValue = seriesCollection.getLowValue(i, j);
int seriesCount2 = timeSeriesCollection.getSeriesCount();
for (int i = 0; i < seriesCount2; i++) {
int itemCount = timeSeriesCollection.getItemCount(i);
for (int j = 0; j < itemCount; j++) {
if (high2Value < timeSeriesCollection.getYValue(i,j)) {
high2Value = timeSeriesCollection.getYValue(i,j);
if (min2Value > timeSeriesCollection.getYValue(i, j)) {
min2Value = timeSeriesCollection.getYValue(i, j);
final CandlestickRenderer candlestickRender=new CandlestickRenderer();
candlestickRender.setUseOutlinePaint(true);
candlestickRender.setAutoWidthMethod(CandlestickRenderer.WIDTHMETHOD_AVERAGE);
candlestickRender.setAutoWidthGap(0.001);
candlestickRender.setUpPaint(Color.RED);
candlestickRender.setDownPaint(Color.GREEN);
DateAxis x1Axis=new DateAxis();
x1Axis.setAutoRange(false);
try{
x1Axis.setRange(dateFormat.parse("2007-08-20"),dateFormat.parse("2007-09-29"));
}catch(Exception e){
e.printStackTrace();
x1Axis.setTimeline(SegmentedTimeline.newMondayThroughFridayTimeline());
x1Axis.setAutoTickUnitSelection(false);
x1Axis.setTickMarkPosition(DateTickMarkPosition.MIDDLE);
x1Axis.setStandardTickUnits(DateAxis.createStandardDateTickUnits());
x1Axis.setTickUnit(new DateTickUnit(DateTickUnit.DAY,7));
x1Axis.setDateFormatOverride(new SimpleDateFormat("yyyy-MM-dd"));
NumberAxis y1Axis=new NumberAxis();
y1Axis.setAutoRange(false);
y1Axis.setRange(minValue*0.9, highValue*1.1);
y1Axis.setTickUnit(new NumberTickUnit((highValue*1.1-minValue*0.9)/10));
XYPlot plot1=new XYPlot(seriesCollection,x1Axis,y1Axis,candlestickRender);
XYBarRenderer xyBarRender=new XYBarRenderer(){
private static final long serialVersionUID = 1L;
public Paint getItemPaint(int i, int j){
if(seriesCollection.getCloseValue(i,j)>seriesCollection.getOpenValue(i,j)){
return candlestickRender.getUpPaint();
}else{
return candlestickRender.getDownPaint();
xyBarRender.setMargin(0.1);
NumberAxis y2Axis=new NumberAxis();
y2Axis.setAutoRange(false);
y2Axis.setRange(min2Value*0.9, high2Value*1.1);
y2Axis.setTickUnit(new NumberTickUnit((high2Value*1.1-min2Value*0.9)/4));
XYPlot plot2=new XYPlot(timeSeriesCollection,null,y2Axis,xyBarRender);
CombinedDomainXYPlot combineddomainxyplot = new CombinedDomainXYPlot(x1Axis);
combineddomainxyplot.add(plot1, 2);
combineddomainxyplot.add(plot2, 1);
combineddomainxyplot.setGap(10);
JFreeChart chart = new JFreeChart("中国联通", JFreeChart.DEFAULT_TITLE_FONT, combineddomainxyplot, false);
int width = 800;
int height = 600;
File p = new File(imagePath);
if (!p.exists()) {
p.mkdirs();
String imageName = System.currentTimeMillis() + "_k线图" + ".jpeg";
File file = new File(p.getPath() + "/" + imageName);
try {
if(file.exists()) {
file.delete();
ChartUtilities.saveChartAsJPEG(file, chart, width, height);
} catch (IOException e) {
e.printStackTrace();
为了能够保证K线图的上影线和下影线能够和K线图本身的颜色保持一致,找了很多的方法设置都不成功,可以说目前暂不提供单独绘制K线边框颜色的方法,所以,经过本人的实验,对其中的源代码进行了下修改,具体修改的地方是在下载回来的文件目中source\org\jfree\chart\renderer\xy\CandlestickRenderer.java文件,将
修改为如下的代码,这样就会保证K线图的上影线和下影线能够和K线图本身的颜色保持一致,符合中国股票市场K线图形颜色的习惯:
* 生成柱状图-横向
public static void bar3DHx() {
String seriesArray[] = {"菲亚特","奥迪","福特"};
String categoryArray[] = {"速度","喜欢程度","邮寄","用户评价","安全性","使用性"};
int value[] = {310,489,512,589,359,402,501,200,308,580,418,315,480,381,264,185,209,302};
DefaultCategoryDataset dataset = new DefaultCategoryDataset();
int data = 0;
for (int i=0;i<3;i++) {
for (int j = 0; j < 6; j++) {
dataset.addValue(value[data], seriesArray[i], categoryArray[j]);
data++;
StandardChartTheme sct = new StandardChartTheme("CN");
sct.setExtraLargeFont(new Font("宋体", Font.LAYOUT_LEFT_TO_RIGHT, 15));
sct.setRegularFont(new Font("宋体", Font.LAYOUT_LEFT_TO_RIGHT, 15));
sct.setLargeFont(new Font("宋体", Font.LAYOUT_LEFT_TO_RIGHT, 15));
ChartFactory.setChartTheme(sct);
JFreeChart chart = ChartFactory.createBarChart3D(
"汽车使用统计",
"",
"",
dataset,
PlotOrientation.HORIZONTAL,
true, true, false);
CategoryPlot plot = (CategoryPlot) chart.getPlot();
NumberAxis numberAxis = (NumberAxis) plot.getRangeAxis();
int width = 640;
int height = 480;
chart.getLegend().setPosition(RectangleEdge.TOP);
chart.getLegend().setFrame(new BlockBorder(Color.WHITE));
File p = new File(imagePath);
if (!p.exists()) {
p.mkdirs();
String imageName = System.currentTimeMillis() + "_3D柱状图_横向" + ".jpeg";
File file = new File(p.getPath() + "/" + imageName);
try {
if(file.exists()) {
file.delete();
ChartUtilities.saveChartAsJPEG(file, chart, width, height);
} catch (IOException e) {
e.printStackTrace();
private static Date date(final int day, final int month, final int year){
final Calendar calendar = Calendar.getInstance();
calendar.set(year, month, day);
final Date result = calendar.getTime();
return result;
private static IntervalCategoryDataset createSampleDataset() {
final TaskSeries s1 = new TaskSeries("时间表");
final Task t1 = new Task("任务1", date(1, Calendar.JANUARY, 2001), date(5, Calendar.APRIL, 2001));
t1.setPercentComplete(0.8);
s1.add(t1);
final Task t3 = new Task("任务2", date(10, Calendar.APRIL, 2001), date(5, Calendar.MAY, 2001));
final Task st31 = new Task("需求1", date(10, Calendar.APRIL, 2001), date(25, Calendar.APRIL, 2001));
st31.setPercentComplete(0.50);
final Task st32 = new Task("需求2", date(1, Calendar.MAY, 2001), date(5, Calendar.MAY, 2001));
st32.setPercentComplete(1.0);
t3.addSubtask(st31);
t3.addSubtask(st32);
s1.add(t3);
final Task t5 = new Task("任务3", date(2, Calendar.JUNE, 2001), date(2, Calendar.JUNE, 2001));
s1.add(t5);
final Task t6 = new Task("任务4", date(3, Calendar.MARCH, 2001), date(31, Calendar.JULY, 2001));
t6.setPercentComplete(0.60);
s1.add(t6);
final Task t8 = new Task("任务结束", date(10, Calendar.AUGUST, 2001), date(10, Calendar.AUGUST, 2001));
t8.setPercentComplete(0.0);
s1.add(t8);
final Task t9 = new Task("任务试用", date(12, Calendar.AUGUST, 2001), date(12, Calendar.SEPTEMBER, 2001));
t9.setPercentComplete(0.0);
s1.add(t9);
final Task t10 = new Task("任务测试", date(13, Calendar.SEPTEMBER, 2001), date(31, Calendar.OCTOBER, 2001));
t10.setPercentComplete(0.2);
s1.add(t10);
final Task t12 = new Task("全部结束", date(28, Calendar.NOVEMBER, 2001), date(30, Calendar.NOVEMBER, 2001));
t12.setPercentComplete(0.0);
s1.add(t12);
final TaskSeriesCollection collection = new TaskSeriesCollection();
collection.add(s1);
return collection;
3、调用测试生成对应的图片
public static void main(String[] args) throws Exception {
testPie();
testLine();
testBar();
testCreateManyLineChart();
bar3D();
bubble();
sequenceDiagram();
4、生成的图片示例
4.1 饼图
4.2 折线图
4.3 柱状图
4.4 折线图-多条
4.5 生成3D柱状图
4.6 生成气泡图
4.7 生成时序图
4.8 生成曲线图
4.9 生成环形图
 4.10 生成区域图
4.11 气泡图2
4.12 生成分布图
4.13 生成联合分类图-折线、柱状
4.14 双X轴图
4.15 甘特图
4.16 K线图
4.17 柱状图-横向
码奴生来只知道前进
Java开发工程师
20.7k
粉丝

