引入库
import numpy as np
import pandas as pd
import seaborn as sns
import matplotlib.pyplot as plt
读取数据
tips = pd.read_csv('tips.csv')
tips.head()

iris = pd.read_csv('iris.csv')
iris.head()

绘图
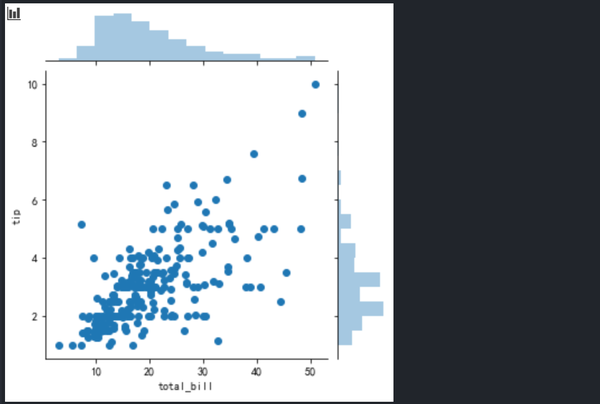
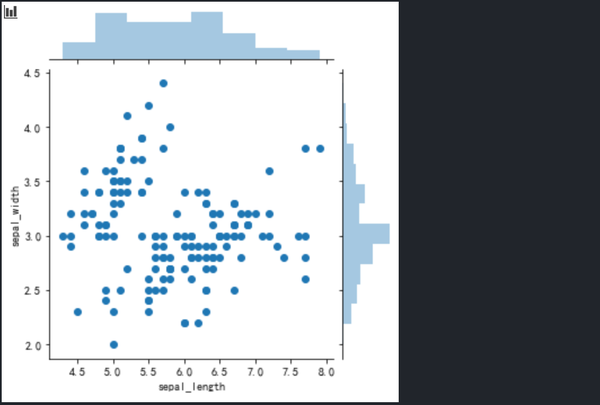
设置x、y轴数据,设置高度
sns.jointplot(x='total_bill',y='tip',data=tips,height=5)

sns.jointplot(x='sepal_length',y='sepal_width',data=iris,height=5)

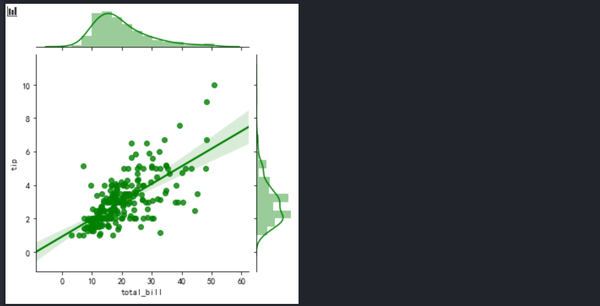
设置绘图种类为reg,颜色为green
sns.jointplot(x='total_bill',y='tip',data=tips,kind='reg',height=5,color='green')

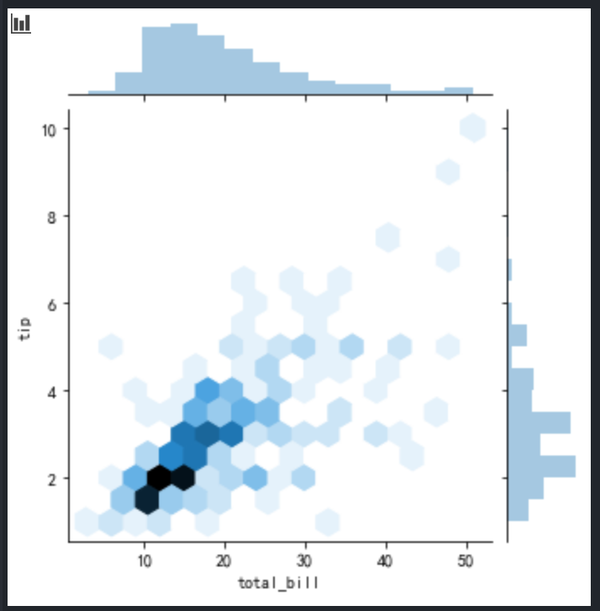
设置为hex图
sns.jointplot(x='total_bill',y='tip',data=tips,kind='hex',height=5)

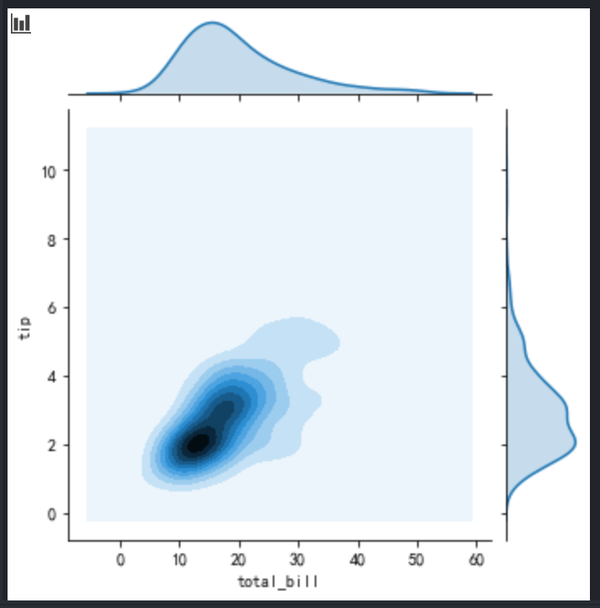
设置为kde图
sns.jointplot(x='total_bill',y='tip',data=tips,kind='kde',height=5)

sns.jointplot(x='sepal_length',y='sepal_width',data=iris,kind='kde',height=5)

使用spearmanr设置stat_func
from scipy.stats import spearmastat_funcnr


