Stata学习:如何进行PSM-DID?

一、详细解读
0. 数据导入
导入自带数据集:
webuse nlswork.dta,clear1. 前期处理
设置面板:
xtset idcode year, delta(1)
       panel variable:  idcode (unbalanced)
        time variable:  year, 68 to 88, but with gaps
                delta:  1 unit
变量加工与描述性统计:
xtdescribe
g age2= age^2
g ttl_exp2=ttl_exp^2
g tenure2=tenure^2
global xlist "grade age age2 ttl_exp ttl_exp2 tenure tenure2 not_smsa south race"
sum ln_w $xlist
2. 传统DID
在这个数据集中,政策执行时间为1977年,因此设置:
g time = (year >= 77) & !missing(year) 而政策执行地方为idcode大于2000的地方,因此设置:
g treated = (idcode >2000)&!missing(idcode) 生成政策变量:
g did = time*treated 采用OLS估计:
reg ln_w did time treated $xlist
      Source |       SS           df       MS      Number of obs   =    28,091
-------------+----------------------------------   F(13, 28077)    =   1295.76
       Model |  2405.08413        13  185.006471   Prob > F        =    0.0000
    Residual |  4008.77975    28,077  .142778066   R-squared       =    0.3750
-------------+----------------------------------   Adj R-squared   =    0.3747
       Total |  6413.86388    28,090  .228332641   Root MSE        =    .37786
------------------------------------------------------------------------------
     ln_wage |      Coef.   Std. Err.      t    P>|t|     [95% Conf. Interval]
-------------+----------------------------------------------------------------
         did |   .0124603   .0094099     1.32   0.185    -.0059836    .0309042
        time |  -.0694754   .0097324    -7.14   0.000    -.0885513   -.0503996
     treated |  -.0142815   .0078374    -1.82   0.068    -.0296431    .0010801
       grade |   .0633445   .0010293    61.54   0.000      .061327     .065362
         age |   .0484968   .0036834    13.17   0.000     .0412771    .0557165
        age2 |  -.0008259   .0000583   -14.18   0.000    -.0009401   -.0007117
     ttl_exp |   .0250849    .002395    10.47   0.000     .0203906    .0297793
    ttl_exp2 |   .0002872   .0001266     2.27   0.023      .000039    .0005353
      tenure |   .0460783    .001968    23.41   0.000     .0422209    .0499356
     tenure2 |  -.0019604   .0001341   -14.62   0.000    -.0022233   -.0016976
    not_smsa |  -.1686808   .0051713   -32.62   0.000    -.1788169   -.1585447
       south |  -.1017625   .0055672   -18.28   0.000    -.1126745   -.0908504
        race |  -.0528909   .0049329   -10.72   0.000    -.0625597   -.0432221
       _cons |   .1400083   .0535917     2.61   0.009     .0349661    .2450506
------------------------------------------------------------------------------
固定效应模型:
xtreg ln_w did time treated $xlist i.year, fe
Fixed-effects (within) regression               Number of obs     =     28,091
Group variable: idcode                          Number of groups  =      4,697
R-sq:                                           Obs per group:
     within  = 0.1781                                         min =          1
     between = 0.3576                                         avg =        6.0
     overall = 0.2666                                         max =         15
                                                F(23,23371)       =     220.25
corr(u_i, Xb)  = 0.1840                         Prob > F          =     0.0000
------------------------------------------------------------------------------
     ln_wage |      Coef.   Std. Err.      t    P>|t|     [95% Conf. Interval]
-------------+----------------------------------------------------------------
         did |    .019761    .008746     2.26   0.024     .0026182    .0369037
        time |  -.3296955   .2012367    -1.64   0.101    -.7241326    .0647416
     treated |          0  (omitted)
       grade |          0  (omitted)
         age |   .0665613   .0105138     6.33   0.000     .0459536    .0871689
        age2 |  -.0009369   .0000616   -15.20   0.000    -.0010577    -.000816
     ttl_exp |   .0392161    .003072    12.77   0.000     .0331947    .0452375
    ttl_exp2 |  -.0001047   .0001352    -0.77   0.439    -.0003697    .0001603
      tenure |   .0338566   .0018579    18.22   0.000     .0302151    .0374981
     tenure2 |  -.0018164    .000126   -14.42   0.000    -.0020633   -.0015695
    not_smsa |   -.086641   .0095117    -9.11   0.000    -.1052846   -.0679974
       south |  -.0597302   .0109246    -5.47   0.000    -.0811431   -.0383173
        race |          0  (omitted)
        year |
         69  |   .0423343    .015528     2.73   0.006     .0118984    .0727702
         70  |  -.0339863    .022938    -1.48   0.138    -.0789464    .0109737
         71  |  -.0299658   .0318704    -0.94   0.347     -.092434    .0325023
         72  |  -.0584678   .0412716    -1.42   0.157    -.1393627    .0224272
         73  |  -.0961513   .0508379    -1.89   0.059     -.195797    .0034943
         75  |  -.1513149   .0698104    -2.17   0.030    -.2881479   -.0144818
         77  |   .1558488   .1129486     1.38   0.168    -.0655379    .3772354
         78  |   .1417381   .1027217     1.38   0.168    -.0596031    .3430793
         80  |   .0826885   .0834407     0.99   0.322    -.0808607    .2462377
         82  |   .0268096   .0638067     0.42   0.674    -.0982557     .151875
         83  |   .0103961    .054166     0.19   0.848    -.0957727     .116565
         85  |    .007777   .0347411     0.22   0.823    -.0603178    .0758717
         87  |  -.0223798   .0162763    -1.37   0.169    -.0542825    .0095229
         88  |          0  (omitted)
       _cons |   .5038214   .1945871     2.59   0.010     .1224179    .8852249
-------------+----------------------------------------------------------------
     sigma_u |   .3532234
     sigma_e |   .2898202
         rho |  .59764928   (fraction of variance due to u_i)
------------------------------------------------------------------------------
F test that all u_i=0: F(4696, 23371) = 6.58                 Prob > F = 0.0000
3. PSM-DID
一般匹配
定义种子:
set seed 0001生成随机数并随机整理:
g tmp = runiform()
sort tmp
近邻匹配:
psmatch2 treated $xlist, out(ln_w) logit ate neighbor(1) common caliper(.05) ties
Logistic regression                             Number of obs     =     28,091
                                                LR chi2(10)       =   10093.80
                                                Prob > chi2       =     0.0000
Log likelihood =  -13636.63                     Pseudo R2         =     0.2701
------------------------------------------------------------------------------
     treated |      Coef.   Std. Err.      z    P>|z|     [95% Conf. Interval]
-------------+----------------------------------------------------------------
       grade |  -.0342869   .0070082    -4.89   0.000    -.0480227   -.0205511
         age |   .1726049   .0227237     7.60   0.000     .1280673    .2171424
        age2 |  -.0026816   .0003693    -7.26   0.000    -.0034054   -.0019577
     ttl_exp |  -.0681925   .0155242    -4.39   0.000    -.0986193   -.0377657
    ttl_exp2 |   .0040423   .0008363     4.83   0.000     .0024031    .0056815
      tenure |  -.0138884   .0128354    -1.08   0.279    -.0390453    .0112686
     tenure2 |   .0002263   .0008671     0.26   0.794    -.0014733    .0019259
    not_smsa |   .4024444   .0355904    11.31   0.000     .3326885    .4722002
       south |   2.865226   .0409688    69.94   0.000     2.784928    2.945523
        race |   .7655284    .034012    22.51   0.000     .6988662    .8321907
       _cons |  -3.400584   .3254663   -10.45   0.000    -4.038487   -2.762682
------------------------------------------------------------------------------
----------------------------------------------------------------------------------------
        Variable     Sample |    Treated     Controls   Difference         S.E.   T-stat
----------------------------+-----------------------------------------------------------
         ln_wage  Unmatched | 1.62754443   1.75722818  -.129683748   .005816206   -22.30
                        ATT | 1.62798811   1.70873922  -.080751107   .021132148    -3.82
                        ATU | 1.75707925   1.75230645  -.004772802            .        .
                        ATE |                          -.051698588            .        .
----------------------------+-----------------------------------------------------------
Note: S.E. does not take into account that the propensity score is estimated.
 psmatch2: |   psmatch2: Common
 Treatment |        support
assignment | Off suppo  On suppor |     Total
-----------+----------------------+----------
 Untreated |         2     10,733 |    10,735
   Treated |        20     17,336 |    17,356
-----------+----------------------+----------
     Total |        22     28,069 |    28,091
检验协变量在处理组与控制组之间是否平衡:
pstest $xlist, both graph
----------------------------------------------------------------------------------------
                Unmatched |       Mean               %reduct |     t-test    |  V(T)/
Variable          Matched | Treated Control    %bias  |bias| |    t    p>|t| |  V(C)
--------------------------+----------------------------------+---------------+----------
grade                  U  | 12.341   12.853    -22.3         | -18.01  0.000 |  1.18*
                       M  | 12.348   12.645    -12.9    42.1 | -12.03  0.000 |  1.15*
                          |                                  |               |
age                    U  | 29.223   28.848      5.6         |   4.56  0.000 |  0.94*
                       M  | 29.216   30.875    -24.7  -342.5 | -23.65  0.000 |  1.05*
                          |                                  |               |
age2                   U  |  897.8   878.68      4.7         |   3.86  0.000 |  0.95*
                       M  | 897.33   994.81    -24.1  -409.7 | -22.80  0.000 |  1.01
                          |                                  |               |
ttl_exp                U  | 6.2403   6.2447     -0.1         |  -0.08  0.938 |  1.05*
                       M  | 6.2334   6.9942    -16.4-17031.2 | -14.80  0.000 |  0.92*
                          |                                  |               |
ttl_exp2               U  | 61.008   60.008      1.2         |   1.01  0.312 |  1.03
                       M  | 60.849   72.756    -14.8 -1090.6 | -12.91  0.000 |  0.79*
                          |                                  |               |
tenure                 U  | 3.0891   3.1782     -2.4         |  -1.93  0.053 |  0.96*
                       M  | 3.0899   2.9777      3.0   -25.9 |   2.87  0.004 |  1.10*
                          |                                  |               |
tenure2                U  |  23.41   24.482     -1.9         |  -1.60  0.110 |  0.90*
                       M  | 23.423   21.518      3.5   -77.7 |   3.41  0.001 |  1.14*
                          |                                  |               |
not_smsa               U  | .32945   .20689     27.9         |  22.36  0.000 |     .
                       M  | .32897   .32066      1.9    93.2 |   1.65  0.099 |     .
                          |                                  |               |
south                  U  |   .618   .07219    140.2         | 107.35  0.000 |     .
                       M  | .61756   .61802     -0.1    99.9 |  -0.09  0.930 |     .
                          |                                  |               |
race                   U  | 1.3912   1.1631     50.3         |  39.53  0.000 |  1.91*
                       M  | 1.3896   1.3763      2.9    94.2 |   2.43  0.015 |  1.05*
                          |                                  |               |
----------------------------------------------------------------------------------------
* if variance ratio outside [0.97; 1.03] for U and [0.97; 1.03] for M
-----------------------------------------------------------------------------------
 Sample    | Ps R2   LR chi2   p>chi2   MeanBias   MedBias      B      R     %Var
-----------+-----------------------------------------------------------------------
 Unmatched | 0.272  10149.10    0.000     25.7       5.2     145.8*   3.70*    88
 Matched   | 0.019    932.83    0.000     10.4       8.2      33.1*   1.16     88
-----------------------------------------------------------------------------------
* if B>25%, R outside [0.5; 2]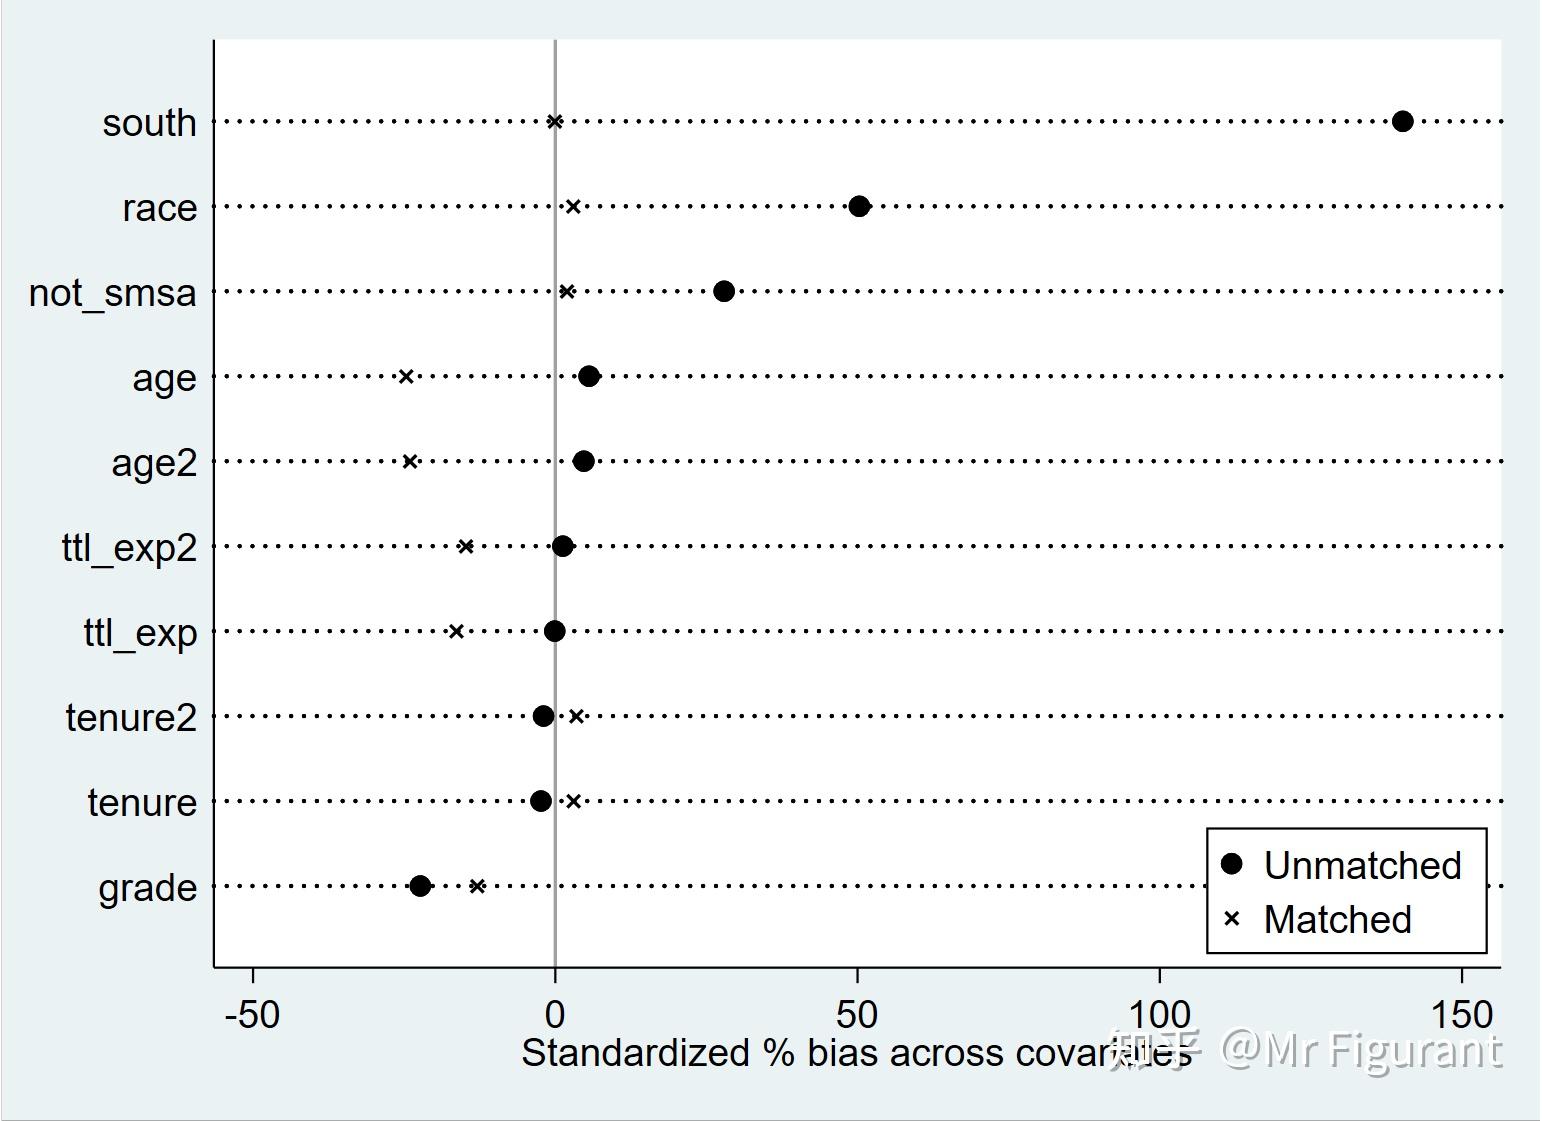
去掉不满足共同区域假定的观测值:
gen common=_support
drop if common == 0
根据上面匹配好的数据,进行DID。
首先是OLS:
reg ln_w did time treated $xlist
      Source |       SS           df       MS      Number of obs   =    28,069
-------------+----------------------------------   F(13, 28055)    =   1294.85
       Model |  2402.32966        13  184.794589   Prob > F        =    0.0000
    Residual |   4003.8761    28,055  .142715241   R-squared       =    0.3750
-------------+----------------------------------   Adj R-squared   =    0.3747
       Total |  6406.20576    28,068  .228238769   Root MSE        =    .37778
------------------------------------------------------------------------------
     ln_wage |      Coef.   Std. Err.      t    P>|t|     [95% Conf. Interval]
-------------+----------------------------------------------------------------
         did |   .0130378   .0094101     1.39   0.166    -.0054064    .0314821
        time |   -.069613   .0097317    -7.15   0.000    -.0886876   -.0505384
     treated |  -.0145157    .007837    -1.85   0.064    -.0298765    .0008452
       grade |   .0635306   .0010326    61.53   0.000     .0615067    .0655545
         age |   .0487295   .0036856    13.22   0.000     .0415054    .0559535
        age2 |  -.0008306   .0000583   -14.24   0.000    -.0009449   -.0007163
     ttl_exp |   .0246821   .0023991    10.29   0.000     .0199798    .0293843
    ttl_exp2 |   .0003217   .0001271     2.53   0.011     .0000726    .0005708
      tenure |   .0461767   .0019693    23.45   0.000     .0423168    .0500365
     tenure2 |  -.0019786   .0001343   -14.73   0.000    -.0022419   -.0017154
    not_smsa |  -.1681968   .0051738   -32.51   0.000    -.1783376    -.158056
       south |   -.101765   .0055661   -18.28   0.000    -.1126748   -.0908551
        race |  -.0534454   .0049452   -10.81   0.000    -.0631381   -.0437526
       _cons |   .1361316   .0536086     2.54   0.011     .0310562    .2412069
------------------------------------------------------------------------------
然后是固定效应模型:
xtreg ln_w did time treated $xlist i.year, fe
Fixed-effects (within) regression               Number of obs     =     28,069
Group variable: idcode                          Number of groups  =      4,696
R-sq:                                           Obs per group:
     within  = 0.1782                                         min =          1
     between = 0.3585                                         avg =        6.0
     overall = 0.2678                                         max =         15
                                                F(23,23350)       =     220.19
corr(u_i, Xb)  = 0.1861                         Prob > F          =     0.0000
------------------------------------------------------------------------------
     ln_wage |      Coef.   Std. Err.      t    P>|t|     [95% Conf. Interval]
-------------+----------------------------------------------------------------
         did |   .0199922   .0087501     2.28   0.022     .0028414     .037143
        time |  -.3259785   .2014472    -1.62   0.106    -.7208281    .0688712
     treated |          0  (omitted)
       grade |          0  (omitted)
         age |   .0664258   .0105214     6.31   0.000     .0458031    .0870485
        age2 |  -.0009367   .0000617   -15.18   0.000    -.0010576   -.0008158
     ttl_exp |   .0388635   .0030813    12.61   0.000     .0328238    .0449031
    ttl_exp2 |  -.0000845   .0001359    -0.62   0.534    -.0003508    .0001819
      tenure |   .0339768   .0018608    18.26   0.000     .0303295    .0376241
     tenure2 |  -.0018292   .0001263   -14.48   0.000    -.0020768   -.0015817
    not_smsa |  -.0865921   .0095179    -9.10   0.000    -.1052478   -.0679365
       south |  -.0600416   .0109379    -5.49   0.000    -.0814807   -.0386026
        race |          0  (omitted)
        year |
         69  |   .0425357   .0155411     2.74   0.006     .0120741    .0729974
         70  |  -.0332855   .0229601    -1.45   0.147    -.0782887    .0117178
         71  |  -.0290703    .031901    -0.91   0.362    -.0915985    .0334578
         72  |  -.0573452   .0413132    -1.39   0.165    -.1383217    .0236314
         73  |  -.0947357   .0508901    -1.86   0.063    -.1944837    .0050123
         75  |  -.1496357   .0698826    -2.14   0.032    -.2866102   -.0126612
         77  |   .1540973   .1130656     1.36   0.173    -.0675187    .3757134
         78  |    .140131   .1028285     1.36   0.173    -.0614196    .3416817
         80  |    .081445   .0835287     0.98   0.330    -.0822767    .2451668
         82  |   .0260429   .0638735     0.41   0.683    -.0991533     .151239
         83  |   .0097373   .0542219     0.18   0.857    -.0965412    .1160159
         85  |    .007336   .0347776     0.21   0.833    -.0608304    .0755023
         87  |  -.0225526   .0162929    -1.38   0.166    -.0544878    .0093826
         88  |          0  (omitted)
       _cons |   .5068104   .1947252     2.60   0.009     .1251361    .8884847
-------------+----------------------------------------------------------------
     sigma_u |   .3531224
     sigma_e |  .28988636
         rho |  .59740195   (fraction of variance due to u_i)
------------------------------------------------------------------------------
F test that all u_i=0: F(4695, 23350) = 6.56                 Prob > F = 0.0000
逐年匹配
这里采用Xu等(2022)的思路:
- Xu, L., et al. (2022). How has China's low-carbon city pilot policy influenced its CO2 abatement costs? Analysis from the perspective of the shadow price
- Appendix B. Supplementary data 【数据+Stata+Matlab】
*(1)matching data
use psmdata.dta, clear
forvalue i = 2003/2018{
      preserve
          capture {
              keep if year == `i'
              set seed 10101
              gen  ranorder = runiform()
              sort ranorder
              psmatch2 treated $xlist , outcome(lnMAC) logit neighbor(2)  ///
                                        ties common ate caliper(0.05)
              save `i'.dta, replace
      restore
clear all
use 2003.dta, clear
forvalue k =2004/2018 {
      capture {
          append using `k'.dta
save ybydata.dta, replace
**(2) regression
use ybydata.dta, clear
*- PSM-DID3(samples that meet the Common Support Assumption )
reghdfe lnMAC LCC $xlist if _support == 1, $regopt //Column (3) of Table 5
outreg2 using psm.rtf,bdec(4) sdec(4) append
*- PSM-DID4(frequency-weighted regression)
gen     weight = _weight * 2
replace weight = 1 if treated == 1 & _weight != .
reghdfe  lnMAC LCC  $xlist [fweight = weight], $regopt //Column (4) of Table 5
outreg2 using psm.rtf,bdec(4) sdec(4) append
4. DID的条件检验
4.1 共同趋势假设
生成年度虚拟变量
tab year, g(yrdum)
  interview |
       year |      Freq.     Percent        Cum.
------------+-----------------------------------
         68 |      1,375        4.82        4.82
         69 |      1,232        4.32        9.14
         70 |      1,686        5.91       15.05
         71 |      1,851        6.49       21.53
         72 |      1,693        5.93       27.47
         73 |      1,981        6.94       34.41
         75 |      2,141        7.50       41.91
         77 |      2,171        7.61       49.52
         78 |      1,964        6.88       56.40
         80 |      1,847        6.47       62.88
         82 |      2,085        7.31       70.18
         83 |      1,987        6.96       77.15
         85 |      2,085        7.31       84.45
         87 |      2,164        7.58       92.04
         88 |      2,272        7.96      100.00
------------+-----------------------------------
      Total |     28,534      100.00
生成政策实行前的那些年份与处理虚拟变量的交互项
forval v=1/7{
g treated`v'=yrdum`v'*treated
}
做三个回归:
- 第一列:没有控制变量
- 第二列:如果did依然显著,且treated*这些政策施行前年份交互项并不显著,那就好
- 第三列:工会会影响这个处理组和控制组的共同趋势,因此看看union=0的情形
xtreg ln_w did treated*  i.year ,fe
outreg2 using result_1.doc,replace tstat bdec(3) tdec(2) ctitle(ln_w,Full-sample)addtext(Controls, No,Year Effect, Yes) keep(did treated*)
xtreg ln_w did treated* $xlist i.year ,fe
outreg2 using result_1.doc,append tstat bdec(3) tdec(2) ctitle(ln_w,Full-sample)addtext(Controls, Yes,Year Effect, Yes) keep(did treated*)
xtreg ln_w did treated* $xlist i.year if union!=1 ,fe
outreg2 using result_1.doc,append tstat bdec(3) tdec(2) ctitle(ln_w,union=0)addtext(Controls, Yes,Year Effect, Yes) keep(did treated*)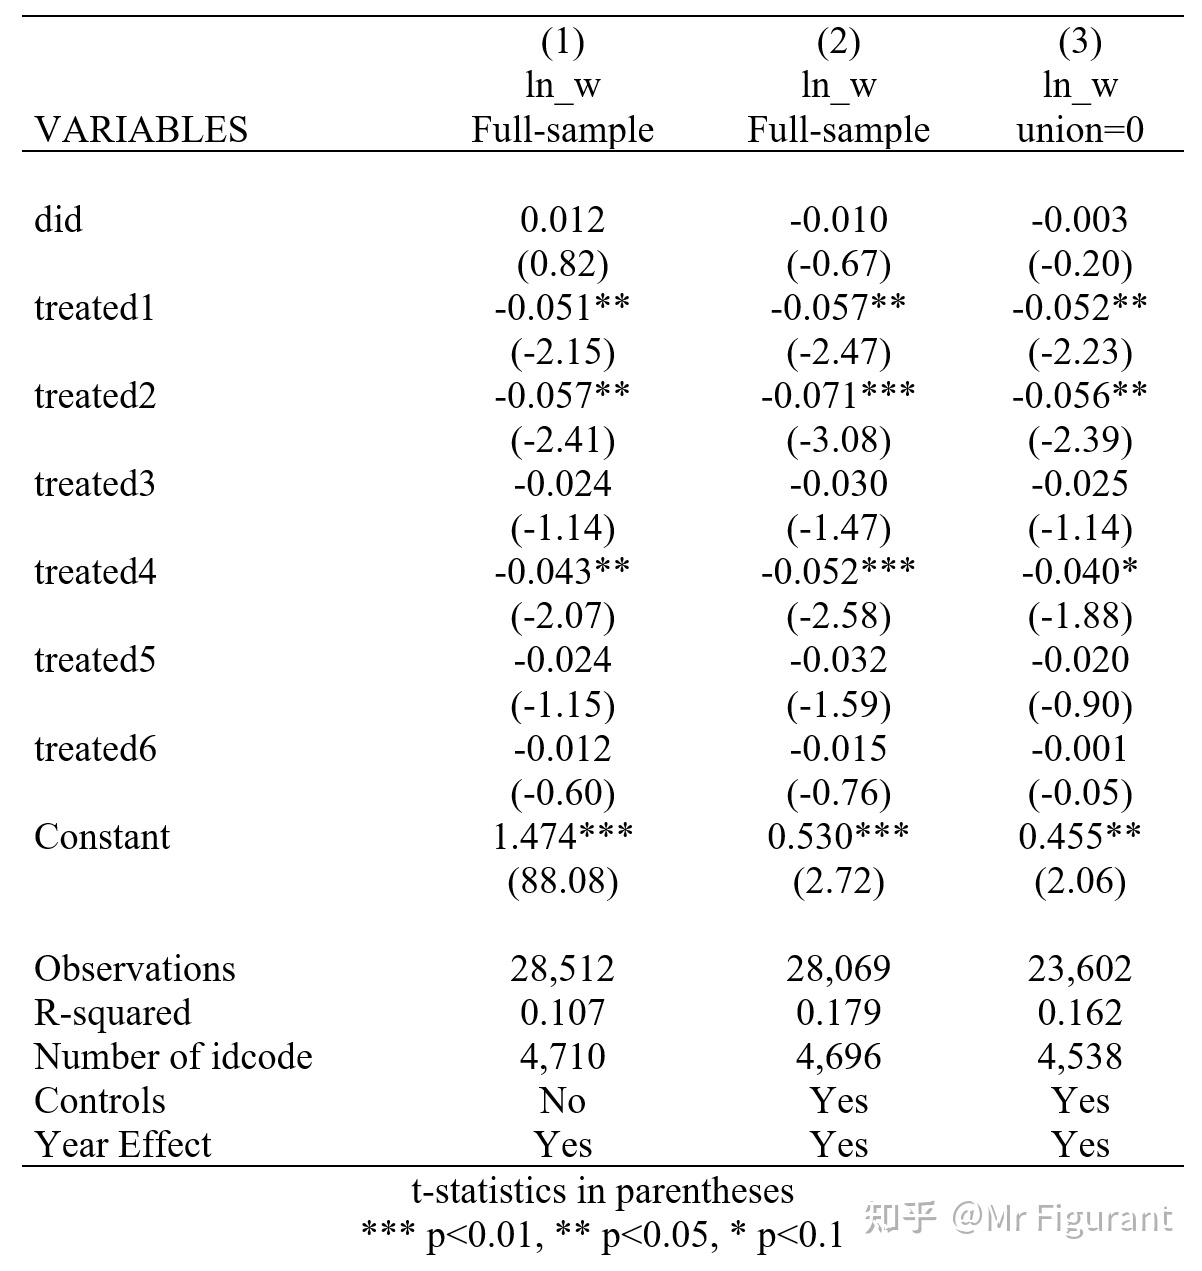
4.2 政策干预时间的随机性
将政策执行时间分别提前到1975年和1976年,重新构造DID变量:
g time1 = (year >= 75) & !missing(year)
g treated_1= (idcode >2000)&!missing(idcode)
g did1 = time1*treated_1
g time2 = (year >= 76) & !missing(year)
g treated_2= (idcode >2000)&!missing(idcode)
g did2 = time2*treated_2
回归结果:
xtreg ln_w did1 $xlist i.year,fe
outreg2 using result_2.doc,replace tstat bdec(3) tdec(2) ctitle(ln_w,Full-sample)addtext(Controls, Yes,Year Effect, Yes) keep(did*)
xtreg ln_w did2 $xlist i.year,fe
outreg2 using result_2.doc,append tstat bdec(3) tdec(2) ctitle(ln_w,Full-sample)addtext(Controls, Yes,Year Effect, Yes) keep(did*)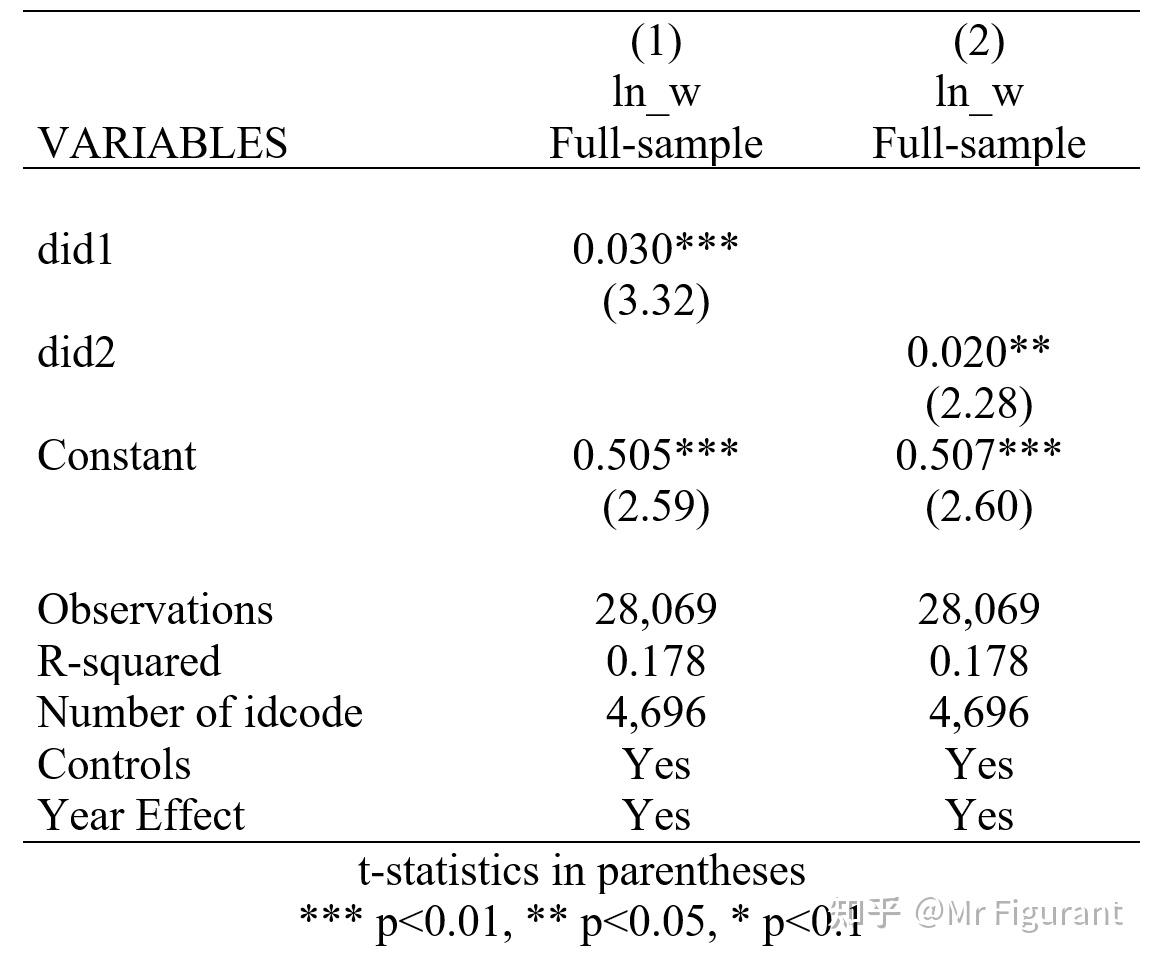
4.3 控制组将不受政策影响
考虑一个并没有受政策影响地方假设其受到政策影响的情况:
g time = (year >= 77) & !missing(year)
g treated_3= (idcode<1600 & idcode>1000)&!missing(idcode)
g did3 = time*treated_3
xtreg ln_w did3 $xlist i.year,fe
------------------------------------------------------------------------------
     ln_wage |      Coef.   Std. Err.      t    P>|t|     [95% Conf. Interval]
-------------+----------------------------------------------------------------
        did3 |   .0047208   .0137331     0.34   0.731     -.022197    .0316387
...
did3不显著,证明控制组不受政策影响。符合预期。
4.4 政策实施的唯一性
至少证明这个政策才是主要影响因素。需要寻找某些受到其他政策影响的地方:
g time4 = (year >= 77) & !missing(year)
g treated_4= (idcode<3000 & idcode>2300)&!missing(idcode)
g did4 = time4*treated_4
xtreg ln_w did4 $xlist i.year,fe
------------------------------------------------------------------------------
     ln_wage |      Coef.   Std. Err.      t    P>|t|     [95% Conf. Interval]
-------------+----------------------------------------------------------------
        did4 |   -.009966   .0129562    -0.77   0.442     -.035361    .0154289
...
这里did4不显著,可以证明政策实施的唯一性。但有时候did4可能依然显著,但是系数变小,证明还受到其他政策影响。
4.5 控制组和政策影响组的分组是随机的
用工具变量来替代政策变量,解决因为分组非随机导致的内生性问题:
xi:xtivreg2 ln_w (did=hours tenure) $xlist i.year,fe first 二、期刊示例
示例1:psmatch2
文献来源
- Zhang, X., et al. (2023). The impact of carbon markets on the financial performance of power producers: Evidence based on China
- Appendix A. Supplementary data 【数据+Stata】
示例代码
cd "C:\Download\1-s2.0-S0140988323006175-mmc1\data and command"
use "data.dta",clear
gen top10=ln(Top10)
gen Soe=0
replace Soe=1 if 公司属性=="中央国有企业"|公司属性=="地方国有企业"
destring stkcd,replace
xtset stkcd time
gen miss1=missing(ROA ,did ,Size ,Leverage ,Growth ,top10 ,Soe)
drop if miss1==1
set seed 10101
gen ranorder = runiform()
sort ranorder
*==========进行一对一匹配========================================
psmatch2 did i.time Size Leverage Growth top10 Soe, outcome(ROA) n(1) ate ties logit common
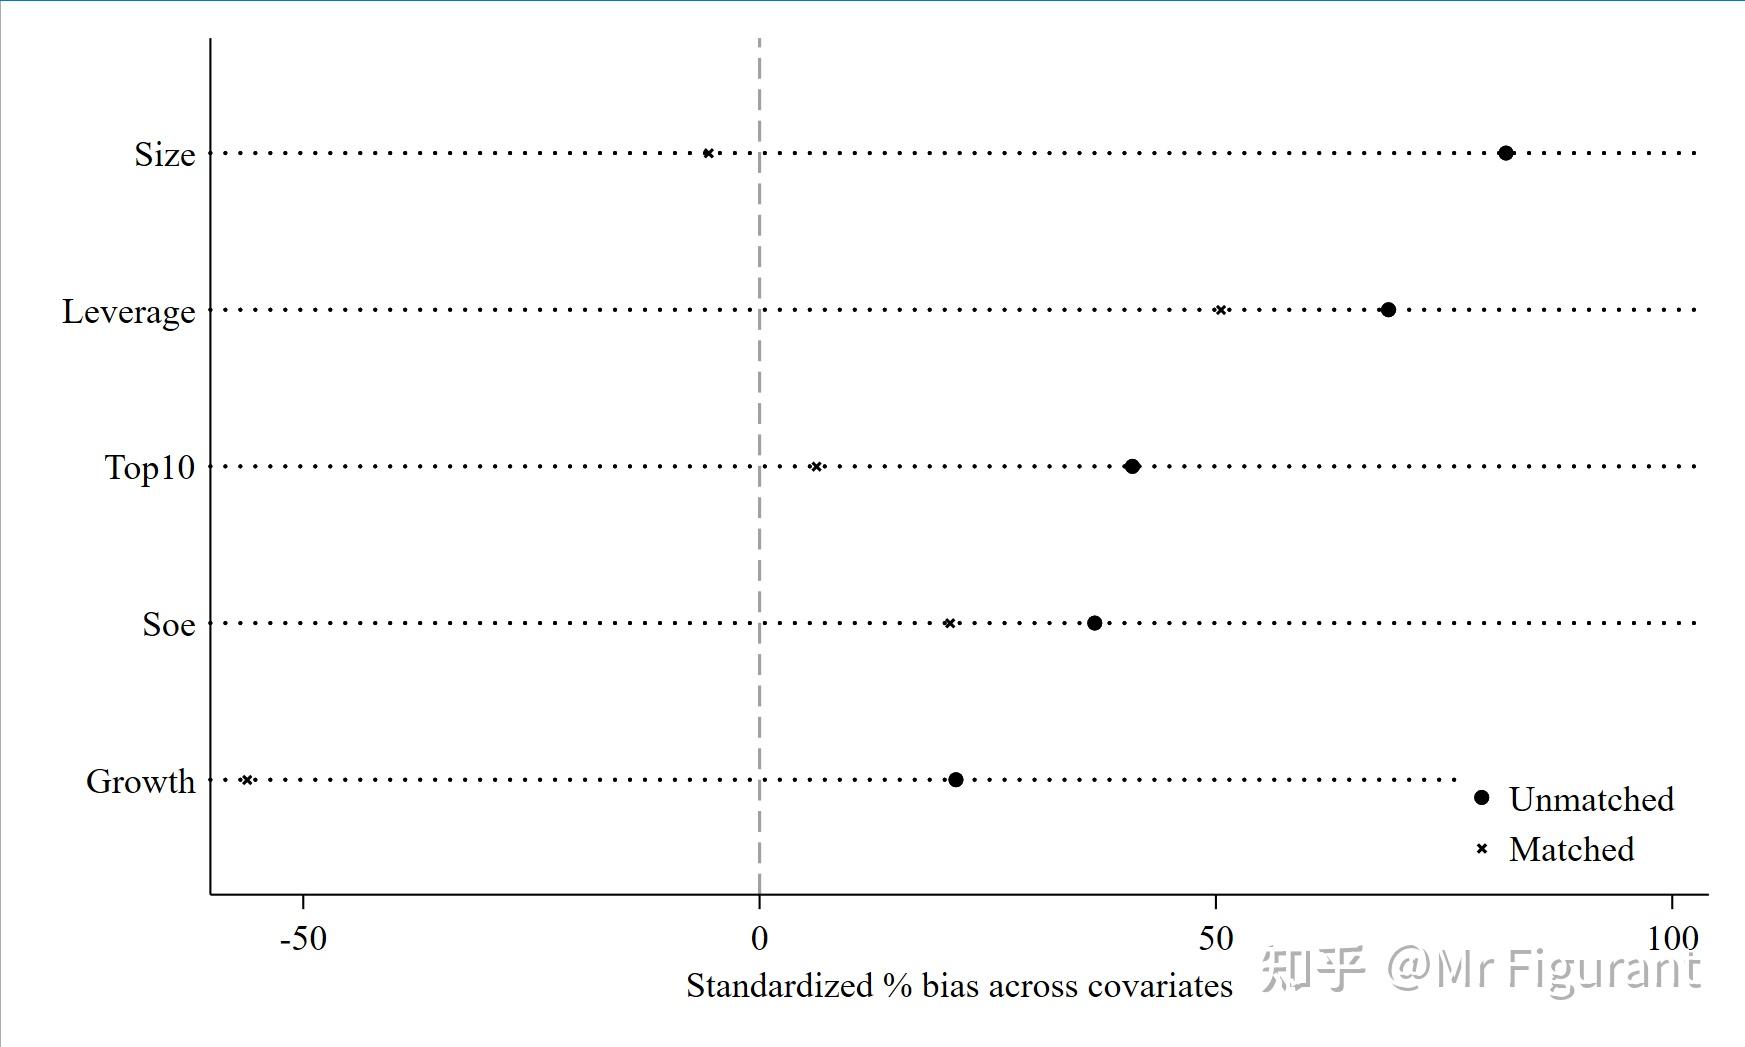
*==========平衡性检验============================================
qui psmatch2 did i.time Size Leverage Growth top10 Soe, outcome(ROA) n(1) ate ties logit common
pstest Size Leverage Growth Top10 Soe, both graph
*====================未匹配结果==================================
psmatch2 did i.time Size Leverage Growth top10 Soe, outcome(ROA) n(1) ate ties logit common
*========(1)一对一匹配===========================================
bootstrap r(att) r(atu) r(ate), reps(100): psmatch2 did i.time Size Leverage Growth top10 Soe, outcome(ROA) n(1) ate ties logit common
gen psm_sample1=1 if _weight!=.
drop _pscore _treated _support _weight _id _n* _pdif
*========(2)邻近匹配,k=4========================================
bootstrap r(att) r(atu) r(ate), reps(100): psmatch2 did i.time Size Leverage Growth top10 Soe, outcome(ROA) n(4) ate ties logit common
sum _pscore
dis 0.25 * r(sd)
gen psm_sample2=1 if _weight!=.
drop _pscore _treated _support _weight _id _n* _pdif
*========(3)卡尺匹配=============================================
bootstrap r(att) r(atu) r(ate), reps(100): psmatch2 did i.time Size Leverage Growth top10 Soe, outcome(ROA) n(4) cal(0.01) ate ties logit common quietly
gen psm_sample3
=1 if _weight!=.
drop _pscore _treated _support _weight _id _n* _pdif
*========(4)半径匹配=============================================
bootstrap r(att) r(atu) r(ate), reps(100): psmatch2 did i.time Size Leverage Growth top10 Soe, outcome(ROA) radius cal(0.01) ate ties logit common quietly
gen psm_sample4=1 if _weight!=.
drop _pscore _treated _support _weight
*========(5)核匹配===============================================
bootstrap r(att) r(atu) r(ate), reps(100): psmatch2 did i.time Size Leverage Growth top10 Soe, outcome(ROA) kernel ate ties logit common quietly
gen psm_sample5=1 if _weight!=.
drop _pscore _treated _support _weight
*========(6)局部线性回归匹配=====================================
bootstrap r(att) r(atu) r(ate), reps(100): psmatch2 did i.time Size Leverage Growth top10 Soe, outcome(ROA) llr ate ties logit common quietly
gen psm_sample6=1 if _weight!=.
drop _pscore _treated _support _weight _id _n* _pdif
*========(7)样条匹配=============================================
set seed 10101
bootstrap r(att) r(atu) r(ate), reps(100): psmatch2 did i.time Size Leverage Growth top10 Soe, outcome(ROA) spline ate ties logit common quietly
gen psm_sample7=1 if _weight!=.
drop _treated _support _weight _id _n*
*========(8)马氏匹配=============================================
psmatch2 did, outcome(ROA) mahal(i.time Size Leverage Growth top10 Soe) n(4) ai(4) ate
gen psm_sample8=1 if _weight!=.
drop _treated _support _weight _id _n*
*****************************************************************
*========生成结果=============================================
sum psm_sample1 psm_sample2 psm_sample3 psm_sample4 psm_sample5 psm_sample6 psm_sample8
xtset stkcd time
cap drop _est*
qui{
reg ROA did Size Leverage Growth top10 Soe i.time if psm_sample1==1,cluster(stkcd) r
est store m1
reg ROA did Size Leverage Growth top10 Soe i.time if psm_sample2==1,cluster(stkcd) r
est store m2
reg ROA did Size Leverage Growth top10 Soe i.time if psm_sample3==1,cluster(stkcd) r
est store m3
reg ROA did Size Leverage Growth top10 Soe i.time if psm_sample4==1,cluster(stkcd) r
est store m4
reg ROA did Size Leverage Growth top10 Soe i.time if psm_sample5==1,cluster(stkcd) r
est store m5
reg ROA did Size Leverage Growth top10 Soe i.time if psm_sample6==1,cluster(stkcd) r
est store m6
reg ROA did Size Leverage Growth top10 Soe i.time if psm_sample8==1,cluster(stkcd) r
est store m8
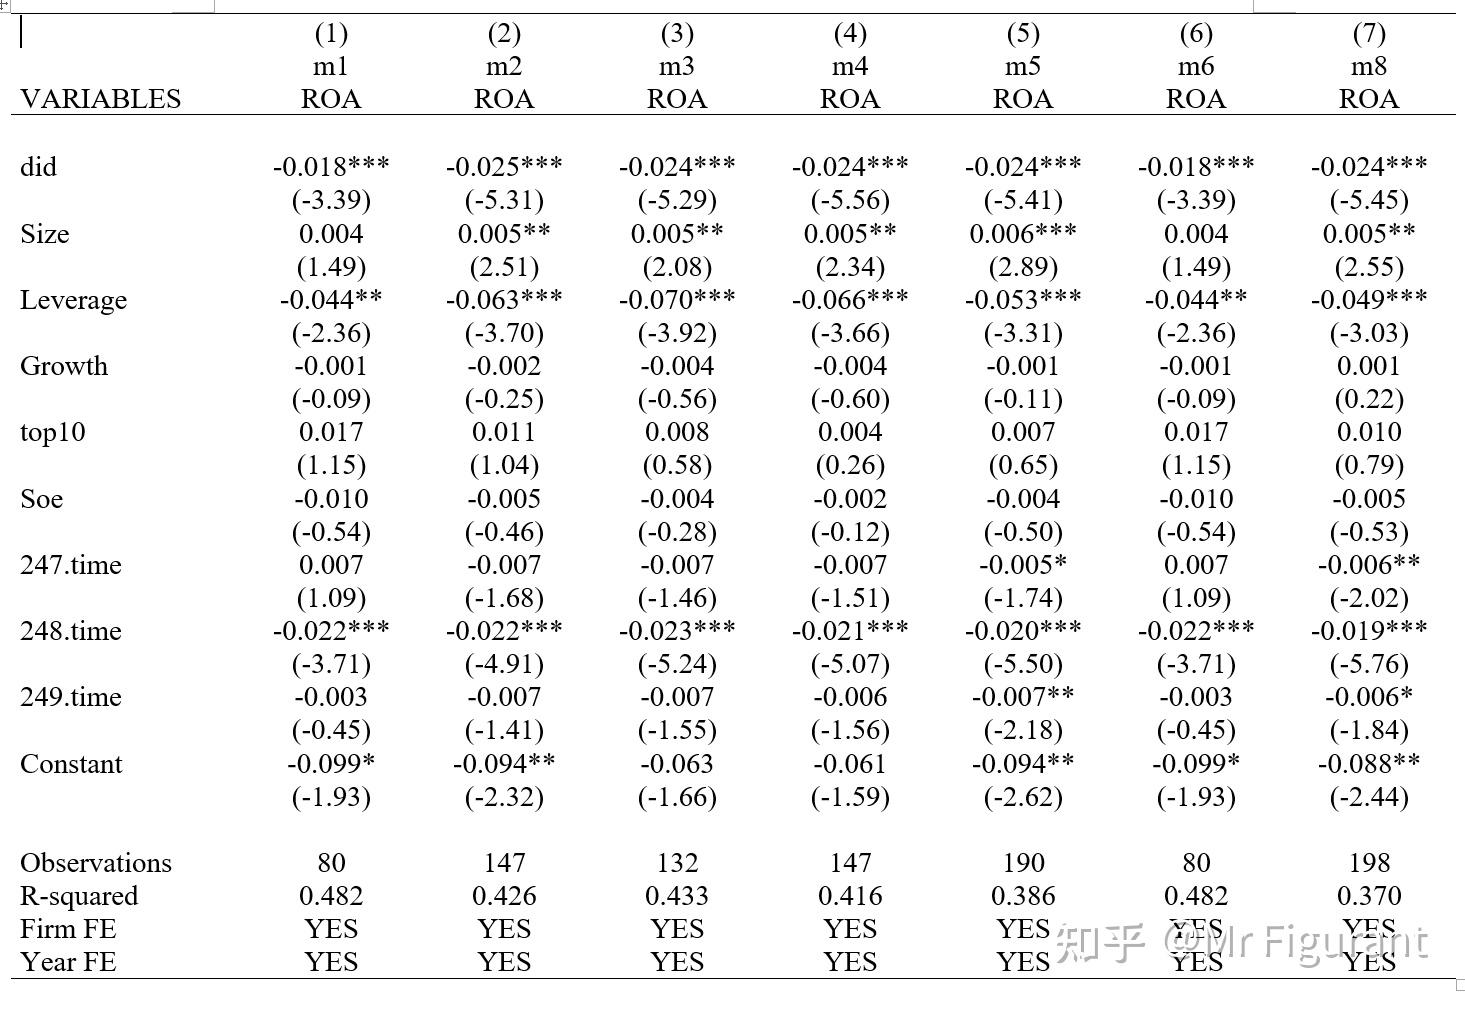
outreg2 [m1 m2 m3 m4 m5 m6 m8] using "倾向得分匹配PSM(内生性2).doc",word replace tstat tdec(2) bdec(3) rdec(3) nonote drop(_Itime_*) sortvar(ROA)addtext(Firm FE,YES,Year FE,YES)得到结果
示例2:kmatch
文献来源
- Shangguan, Y., et al. (2023). Environmental bonuses of employment protection: Evidence from labor contract law in China
- Appendix B. Supplementary data 【数据+Stata】
示例代码
cd "C:\Download\1-s2.0-S0140988323007363-mmc1\DATA & CODE Environmental Bonuses of Employment Protection"
use "Environmental Bonuses of Employment Protection.dta",clear
sum LC2_dum
kmatch ps  LC2_dum  (lny1), ///
        ebalance ( lnFixasset lnLabor acf_sale age sa hhi c_d roa ) ///
		gen(var) wgen(wvar) nn(1)
drop if _KM_ps == .
reghdfe lny1 did2  lnFixasset lnLabor acf_sale age sa hhi c_d roa [pweight=_KM_mw ] , ///
        a( id  year ind4a_year ind4a_cnamecode cnamecode_year ) clu(id)
得到结果
Propensity-score nearest-neighbor matching              Number of obs = 93,066
                                                Neighbors:    min =      46512
Treatment   : LC2_dum = 1                                     max =      46554
Covariates  : (none)
PS model    : logit (pr)
Entropy bal.: targets = 1
              balance tolerance = .00001
              covariates = lnFixasset lnLabor acf_sale age sa hhi c_d roa
              basis = matching weights
Matching statistics
------------------------------------------------------------------------------------------
           |             Matched             |             Controls            |  Balance
           |       Yes         No      Total |      Used     Unused      Total |     loss
-----------+---------------------------------+---------------------------------+----------
   Treated |     46512          0      46512 |     46554          0      46554 |  4.14e-13
 Untreated |     46554          0      46554 |     46512          0      46512 |  1.52e-16
  Combined |     93066          0      93066 |     93066          0      93066 |
------------------------------------------------------------------------------------------
Treatment-effects estimation
------------------------------------------------------------------------------
        lny1 | Coefficient  Std. err.      t    P>|t|     [95% conf. interval]
-------------+----------------------------------------------------------------
         ATE |   .2756808   .0174657    15.78   0.000     .2414481    .3099134
------------------------------------------------------------------------------
Stored variables
Variable      Storage   Display    Value
    name         type    format    label      Variable label
---------------------------------------------------------------------------------------------
var             byte    %8.0g                 Treatment indicator
_KM_nc          long    %10.0g                Number of matched controls
_KM_nm          long    %10.0g                Number of times used as a match
_KM_mw          double  %10.0g                Matching weight
_KM_ps          double  %10.0g                Propensity score
_KM_strata      byte    %8.0g                 Matching stratum
wvar            double  %10.0g                Matching weights for ATE
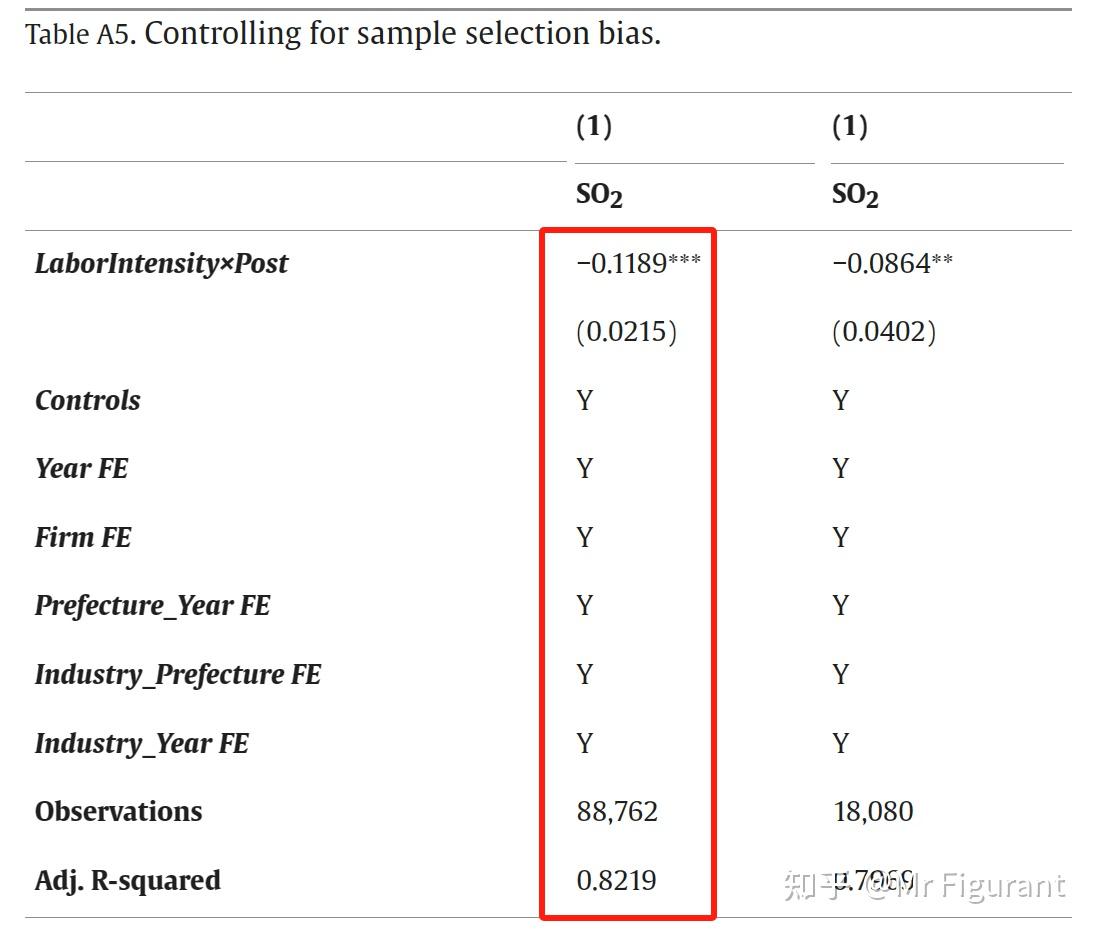
HDFE Linear regression                            Number of obs   =     88,762
Absorbing 5 HDFE groups                           F(   9,  17649) =      62.55
Statistics robust to heteroskedasticity           Prob > F        =     0.0000
                                                  R-squared       =     0.8876
                                                  Adj R-squared   =     0.8219
                                                  Within R-sq.    =     0.0917
Number of clusters (id)      =     17,650         Root MSE        =     0.4057
                                (Std. err. adjusted for 17,650 clusters in id)
------------------------------------------------------------------------------
             |               Robust
        lny1 | Coefficient  std. err.      t    P>|t|     [95% conf. interval]
-------------+----------------------------------------------------------------
        did2 |   -.118895   .0215247    -5.52   0.000    -.1610854   -.0767046
  lnFixasset |  -.1014892   .0089206   -11.38   0.000    -.1189745   -.0840039
     lnLabor |  -.1498149   .0124582   -12.03   0.000    -.1742341   -.1253956
    acf_sale |  -.3305972   .0283343   -11.67   0.000    -.3861353   -.2750591
         age |   .0001202   .0006171     0.19   0.846    -.0010895    .0013299
          sa |   .0235574   .0060927     3.87   0.000     .0116151    .0354997
         hhi |  -3.597629   1.952235    -1.84   0.065    -7.424202     .228945
         c_d |  -.0109467   .0124806    -0.88   0.380    -.0354099    .0135164
         roa |  -.0889202    .044236    -2.01   0.044    -.1756272   -.0022132
       _cons |   4.526707     .25066    18.06   0.000     4.035389    5.018026
------------------------------------------------------------------------------
Absorbed degrees of freedom:
---------------------------------------------------------+
     Absorbed FE | Categories  - Redundant  = Num. Coefs |
-----------------+---------------------------------------|
              id |     17650       17650           0    *|
            year |        10           0          10     |
      ind4a_year |      3194          10        3184     |
 ind4a_cnamecode |      9357         279        9078    ?|
  cnamecode_year |      3072         274        2798    ?|
---------------------------------------------------------+
? = number of redundant parameters may be higher
* = FE nested within cluster; treated as redundant for DoF computation
期刊排版
示例3:psmatch2
文献来源
- Wang, W., et al. (2024). The impact of energy-consuming rights trading on green total factor productivity in the context of digital economy: Evidence from listed firms in China
- Appendix B. Supplementary data 【数据+Stata】
示例代码
/**Near-neighbor matching**/
clear
use data.dta
set seed 103
gen u=runiform()
sort u
psmatch2 du SIZE AGE LEV TOBINQ ROA CAPITAL GROWTH TOP1 INDEP EPI FDI GDP IND,outcome(FGTFP) n(2) ate ties logit common
pstest SIZE AGE LEV TOBINQ ROA CAPITAL GROWTH TOP1 INDEP EPI FDI GDP IND,both graph
psgraph
reghdfe FGTFP c._treated#c.dt SIZE AGE LEV TOBINQ ROA CAPITAL GROWTH TOP1 INDEP EPI FDI GDP IND if _weight!=.,absorb(id year)
reghdfe FGTFP c._treated#c.dt SIZE AGE LEV TOBINQ ROA CAPITAL GROWTH TOP1 INDEP EPI FDI GDP IND if _support ==1,absorb(id year)
/**Radius matching**/
clear
use data.dta
set seed 101
gen u=runiform()
sort u
psmatch2 du SIZE AGE LEV TOBINQ ROA CAPITAL GROWTH TOP1 INDEP EPI FDI GDP IND,outcome(FGTFP) radius ate logit cal(0.01) common
pstest SIZE AGE LEV TOBINQ ROA CAPITAL GROWTH TOP1 INDEP EPI FDI GDP IND,both graph
psgraph
reghdfe FGTFP c._treated#c.dt SIZE AGE LEV TOBINQ ROA CAPITAL GROWTH TOP1 INDEP EPI FDI GDP IND if _weight!=.,absorb(id year)
reghdfe FGTFP c._treated#c.dt SIZE AGE LEV TOBINQ ROA CAPITAL GROWTH TOP1 INDEP EPI FDI GDP IND if _support ==1,absorb(id year)
/**Nuclear matching**/
clear
use data.dta
set seed 104
gen u=runiform()